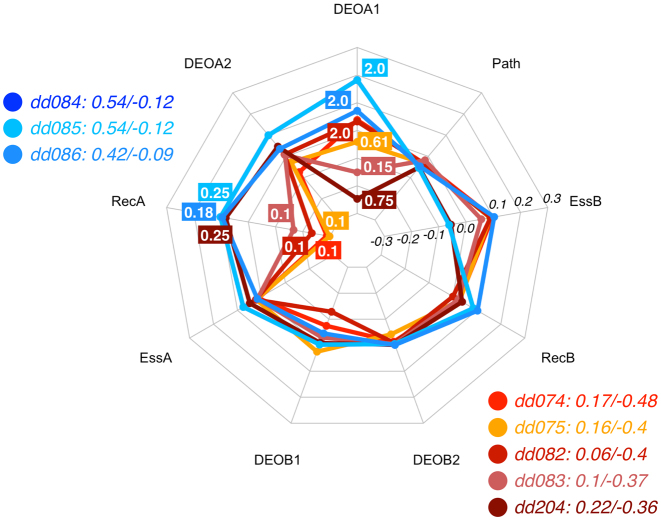
Figure 5.
Radar plot for the decision process of the RF predictor for eight digenic combinations leading to Bardet-Biedl syndrome, i.e. three associated with the CO class (blue spectrum) and five related to the TD class (red spectrum). This visualization shows that the recessiveness in gene A (which can be either BBS2, BBS1 or BBS7) together with DEOA1 pushes the instances towards the TD class. Note that dd084 and dd085 have identical feature values and hence identical contributions, resulting in overlapping lines in the radar plot. See Methods for an explanation of the radar plot. Feature vectors and corresponding decision vectors for these digenic combinations are available in Supplementary Material (Tables S2 and S3).

