. 2017 Jun 15;45(15):9068–9084. doi: 10.1093/nar/gkx519

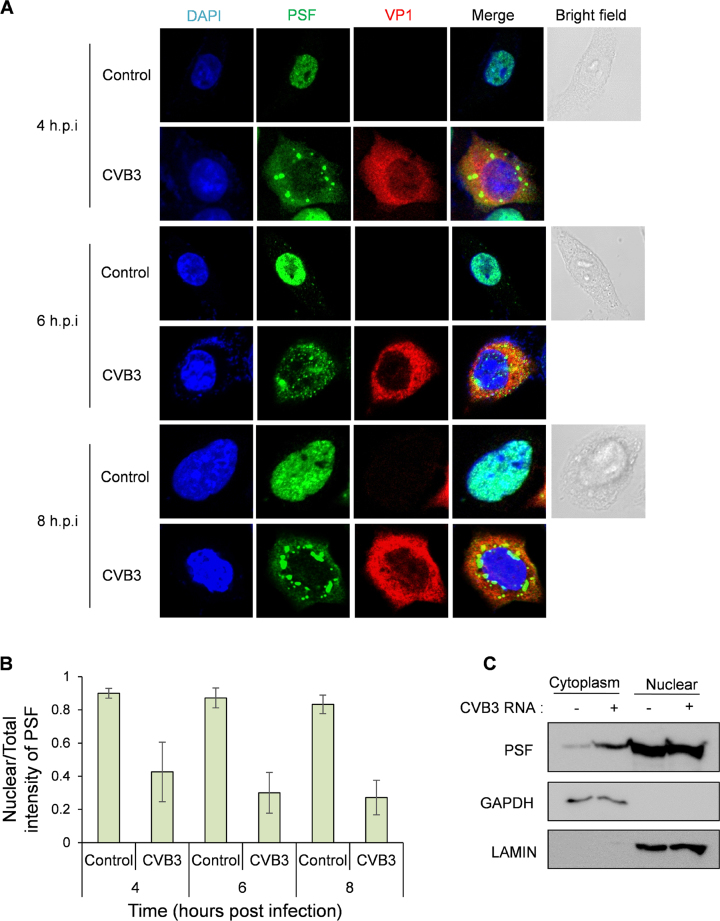
Figure 3. Cytoplasmic abundance of PSF increases in presence of CVB3. (A) Immunofluorescence microscopy of HeLa S3 cells infected with CVB3 or mock infection at different time points post-infection. Green represents PSF, Red represents viral protein VP1 indicating infected cells, blue represents nucleus of the cell. (B) Quantification of the confocal images. Mean intensities of PSF were calculated in total cell and in nucleus using ImageJ software. Ratio of nuclear intensity by total cell intensity is indicated in graph. For 4 h.p.i., 6 h.p.i. and 8 h.p.i. 20, 25 and 40 cells were quantified from three independent experiments. Error bars represent standard deviation in three independent experiments. (C) Western blot analysis of nuclear and cytoplasmic extracts of HeLa S3 cells with and without CVB3 infection. Cells were harvested at 8 hours post infection processed for fractionation. Lamin and GAPDH were used as nuclear and cytoplasmic markers respectively.

Figure 3.