Figure 5.
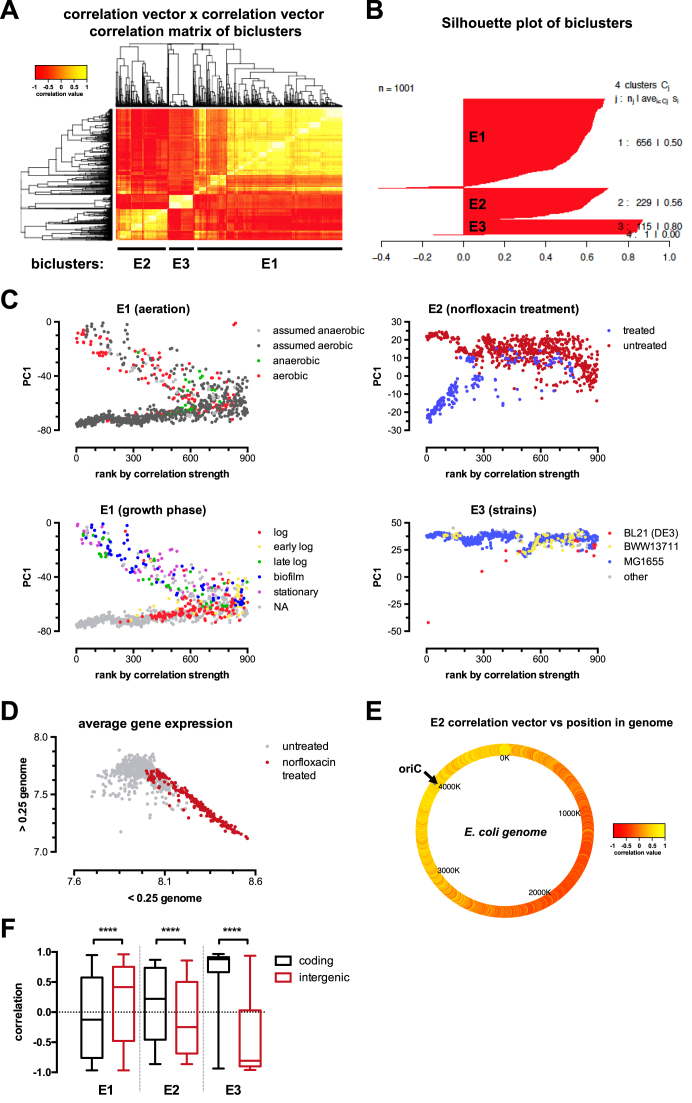
Biologically relevant biclusters discovered by MCBiclust in E. coli. (A) MCbiclust was run 1000 times on the E. coli K-12 microarray data set from the Many Microbe Microarray database (M3D). Results are visualised in a heatmap of the correlation matrix from the correlation vectors. Hierarchical clustering reveals three large bicluster groups (E1–E3). (B) Correlation vectors are divided into three unique bicluster groups (E1–E3) from the output of the silhouette analysis. The silhouette plot of the optimum number of clusters is shown as chosen by maximizing the average silhouette width of all the correlation vectors. (C) PC1 versus sample ranking plots of the unique biclusters E1, E2 and E3. The plots have been overlaid with experimental conditions: aeration and growth phases for E1 (left panels), the gyrase inhibitor norfloxacin treatment for E2 (upper right panel) and the different strains used in the experiments for E3 (lower right panel). (D) Plot of average gene expression values (median centered log2) close (<0.25 genome) versus far (>0.25 genome) to the origin of replication. The distribution of norfloxacin treated (red) and control (non treated, gray) samples are shown. (E) Heatmap of correlation vector values for E2 in relation to genome position (oriC, origin of replication). (F) Box plot of correlation vector values for all biclusters in coding (black) and intergenic (red) regions. The non-parametric Mann-Whitney test was used to calculate significance between pairs of each bicluster. ****P <0.0001

