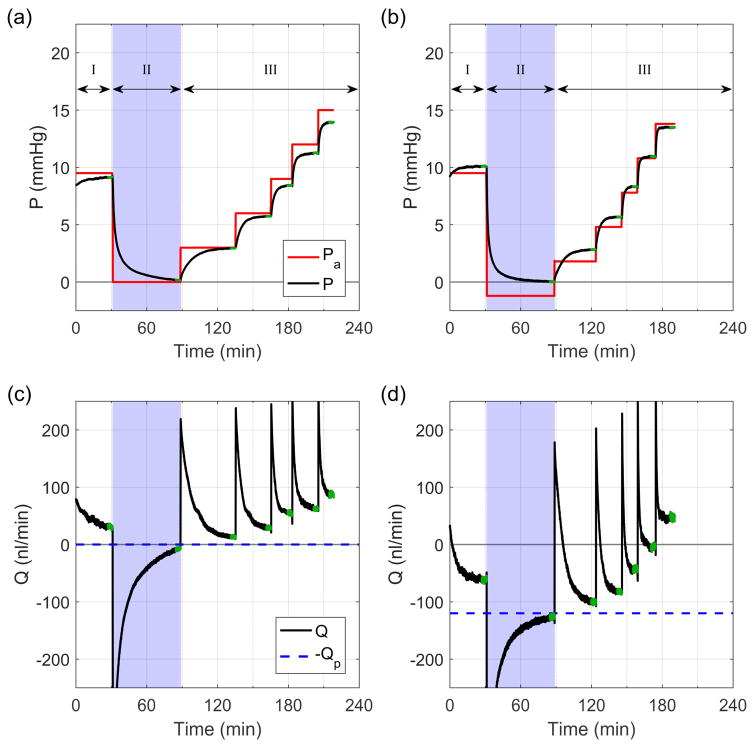
Fig. 2.
Flow (Q) and pressure (P) traces from a typical perfusion from the double cannula experiments. Traces (a) and (c) correspond to recordings from a control eye with Qp = 0 nl/min, while (b) and (d) correspond to recordings from the contralateral experimental eye with Qp = 120 nl/min. Green regions indicate steady state. Note that the difference between Pa and P arises from the resistance of the flow sensor, Rq, and the compliance of the eye.

