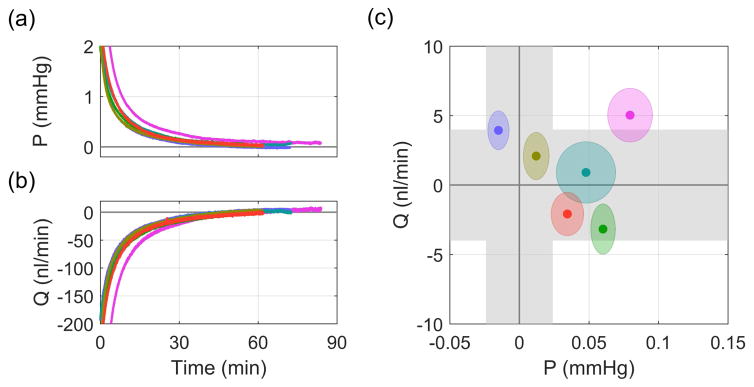
Fig. 4.
Direct measurement of Q(P→0) in the single cannula experiments. (a) Pressure and (b) flow traces after Pa was set to 0 mmHg. (c) Steady state values of pressure and flow. Grey regions indicate sensor uncertainty and ellipses show two standard deviations on the recorded flow and pressure signals.

