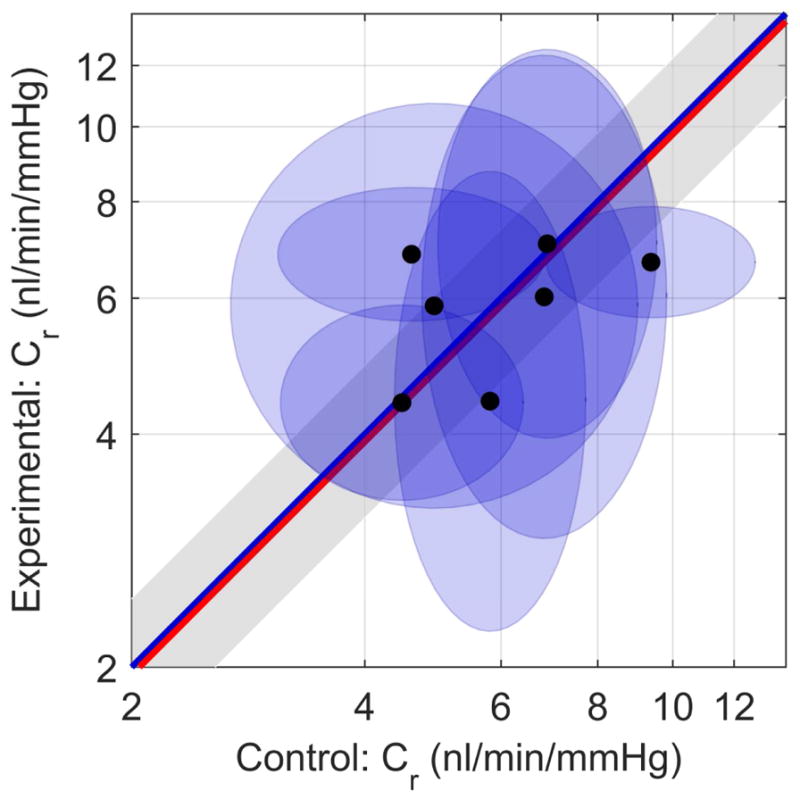
Fig. 6.

Paired plot of reference facility Cr. Control eyes (Qp = 0 nl/min along x-axis), Experimental eyes (Qp = 120 nl/min along y-axis). Each data point represents one mouse, and ellipses indicate 95% confidence intervals on Cr. The blue unity line represents the ideal case of perfect agreement in Cr between contralateral eyes, while the red line indicates the mean difference in measured facility between paired eyes. The grey shaded region indicates the confidence interval on the mean difference.
