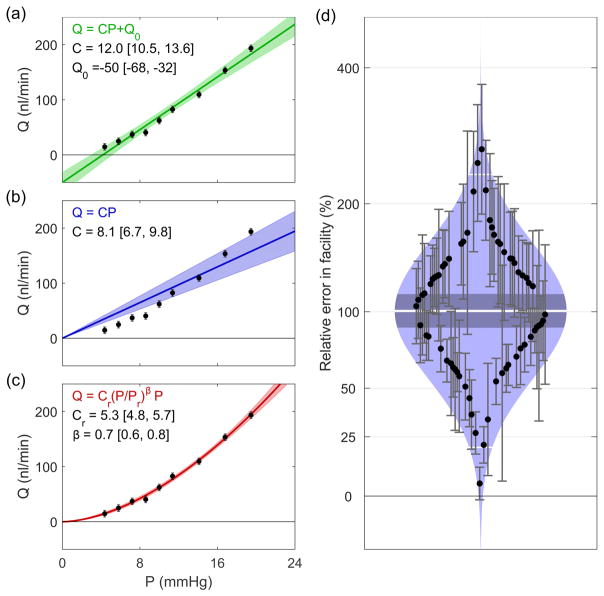
Fig. 7.
Comparison of models for fitting flow-pressure data. (a) Common linear model, (b) linear model with zero intercept, (c) power law model. Shaded regions indicate the 95% confidence intervals of the fits. (d) Cello plot showing relative error in estimates of facility when using the common linear model. Shaded regions indicate predicted lognormal distribution, with the mean (central white line), confidence interval on the mean (central dark band), and ± two standard deviations around the mean (outer white lines). Each data point shows an individual eye and error bars indicate the 95% confidence interval on the relative error. Data reprocessed from (Sherwood et al., 2016).

