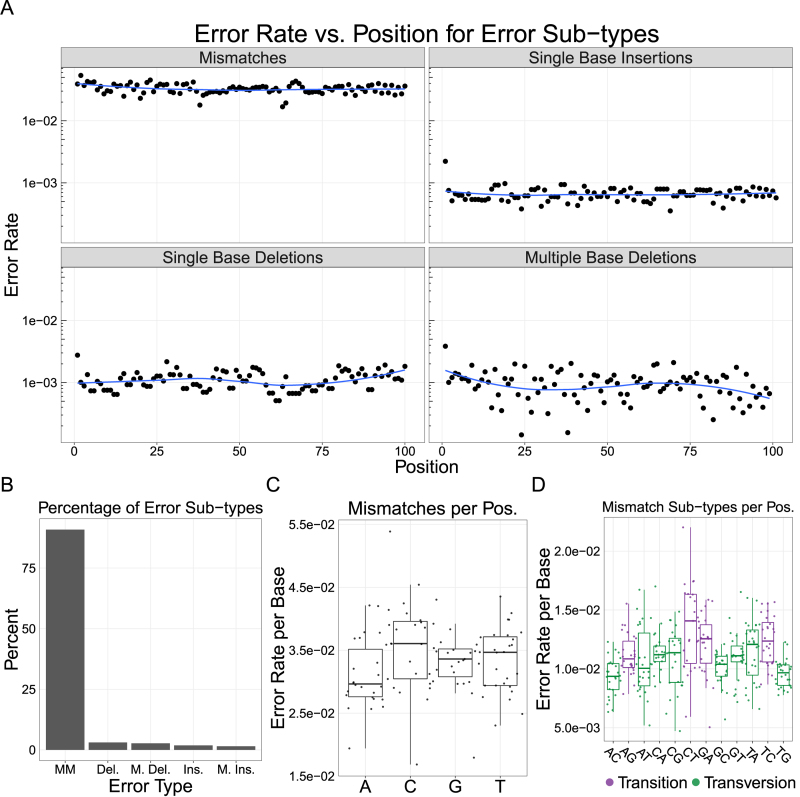
Figure 2.
Analysis of error rates in a model gene assembly created from error-doped oliogs. (A) The error rates per base are plotted across each position in our model separated by the four major classes of error types. We do not see strong positional effects for errors across the template. (B) We find a majority of errors on the template are mismatches (MM), followed by single (Del.) and multiple base (M. Del.) deletions; Single (Ins.) and multiple base (M. Ins.) insertions occur at even lower frequencies. (C) There are no significant differences between the median rate of mismatches at any base (Mann–Whitney U, NS). (D) Similarly, there are no significant differences between transitions and transversions (Mann–Whitney U, NS), implying that the errors were doped uniformly into our oligos. Note: blue line is a LOESS fit; box plots are first and third quartile for hinges, median for bar and 1.5 × the inter-quartile range for whiskers.

