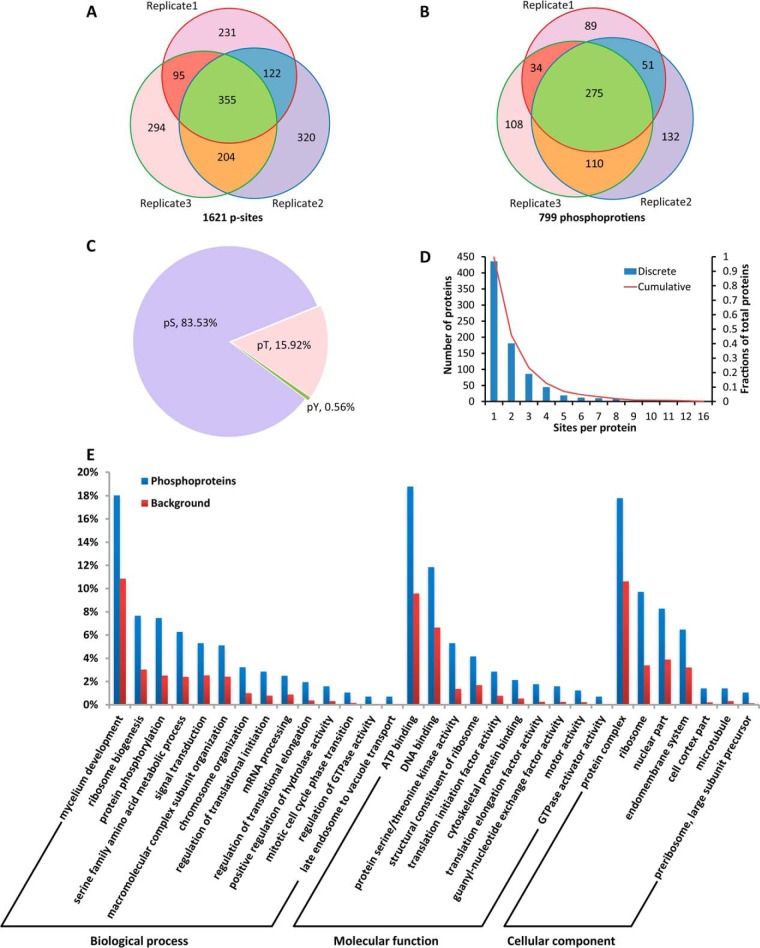
Fig. 2.
Phosphorylation events in mycelia of P. oryzae. A, A Venn diagram depicting numbers of p-sites identified in the three biological duplicates and p-site reproducibility. B, A Venn diagram depicting numbers of phosphoproteins identified in the three biological duplicates and phosphoprotein reproducibility. C, Distribution of phosphorylated Ser, Thr and Tyr sites. D, A histogram depicting numbers of p-sites observed per protein. E, A histogram indicating enriched GO terms of phosphoproteins.

