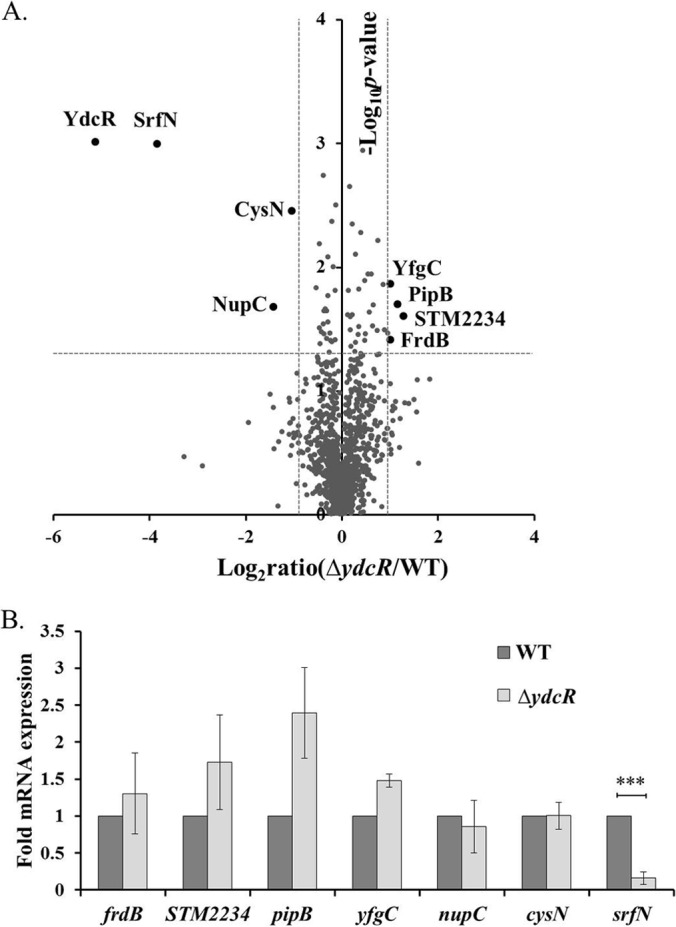
Fig. 3.

YdcR positively regulates the expression of SrfN. A, A volcano plot of intracellular Salmonella proteins detected by LC-MS/MS experiments. The fold changes were calculated by dividing LFQ intensity values from the ΔydcR mutant by those from the wild-type strain at 18 hpi. The logarithmic values of the average fold changes are reported on the x axis. The y axis plots negative logarithmic p values determined from the t test on three biological replicates. Dotted lines denote 2-fold (vertical) and p < 0.05 cutoff (horizontal). B, qRT-PCR analyses of mRNA samples extracted from intracellular Salmonella at 18 hpi (n = 3). Asterisks indicate significant differences (***, p < 0.001).
