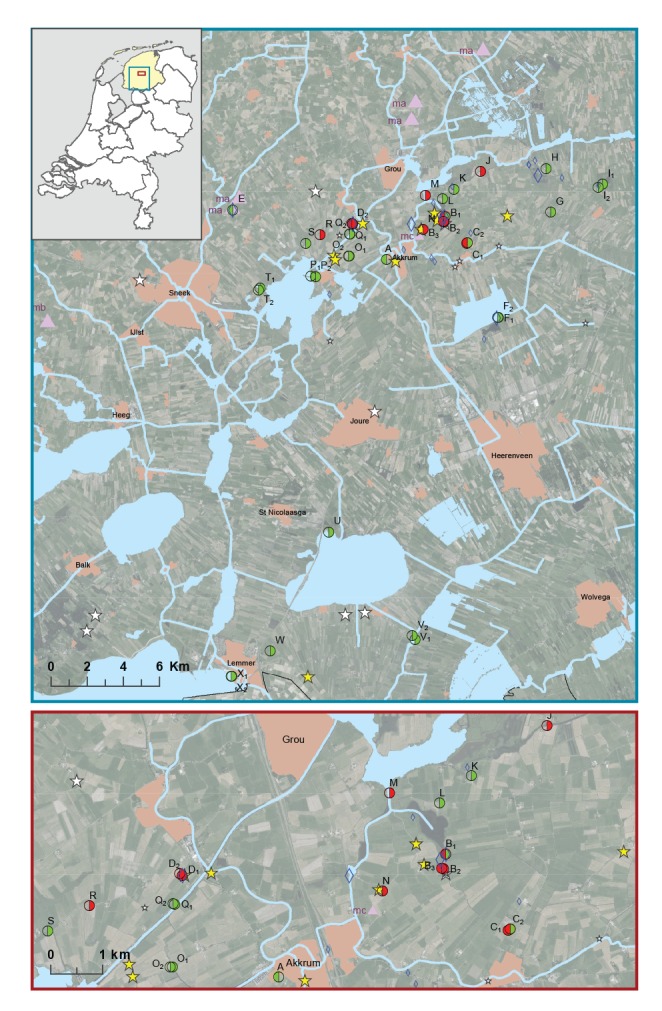
Figure.
Locations of dead brown hares and other tularaemia surveillance samples collected during and after a tularaemia outbreak in hares, the Netherlands, 2015–2016
A–X: surface water sampling locations, numbers represent multiple sampling points at one location; ma: 181 common voles captured using snap traps between February and April; mb: 38 common voles captured alive in April; mc: 38 common voles. captured dead by farmers in August
The insert depicts a map of the Netherlands with the province of Friesland marked in yellow. The blue and red squares indicate the areas covered by the upper and lower maps, respectively. The lower map zooms in on the epizootic area. Locations where dead hares were found during the first and second half of 2015 are indicated by large and small stars, respectively. Yellow stars represent hares where tularaemia was confirmed as cause of death while white stars represent tularaemia-negative hares. Locations where common voles were collected during the first and second half of 2015 are indicated by large and small purple triangles, respectively. Locations where arthropods were collected during the first half of 2015 or in the second half of 2015 or later are indicated by large and small blue diamonds, respectively. Surface water sampling locations are represented by circles. Samples collected on 16 April and on 29 May are indicated by the left half and right half of the circle, respectively. Presence of F. tularensis DNA is indicated by the colours red (detected) or green (not detected). Transparency signifies that no samples were collected on that date.