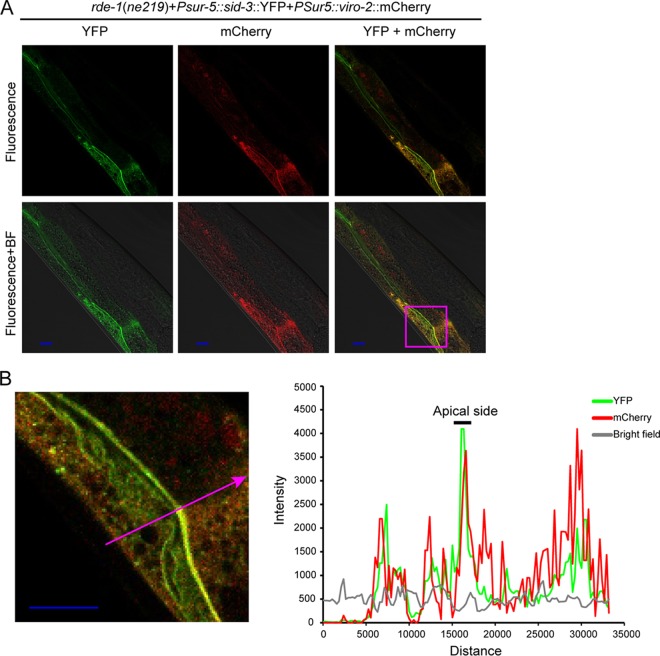
FIG 7 .
SID-3 and VIRO-2 colocalize in transgenic strains. (A and B) Confocal microscopy of a representative animal of the rde-1(ne219) strain (sid-3::YFP and viro-2::mCherry fusion proteins driven by the universal sur-5 gene promoter) 48 h after Orsay virus infection. BF, bright-field microscopy. Bars, 10 μm. The zoomed-in area shown in the micrograph in panel B is indicated by the magenta box in panel A. The graph in panel B shows fluorescence intensity (in AU [arbitrary unit]) on the y axis and distance (in nm) on the x axis. The graph shows fluorescence intensity profiling of the position marked by the magenta arrow. The intestinal apical side is indicated in the graph by a black bar.

