FIG 1 .
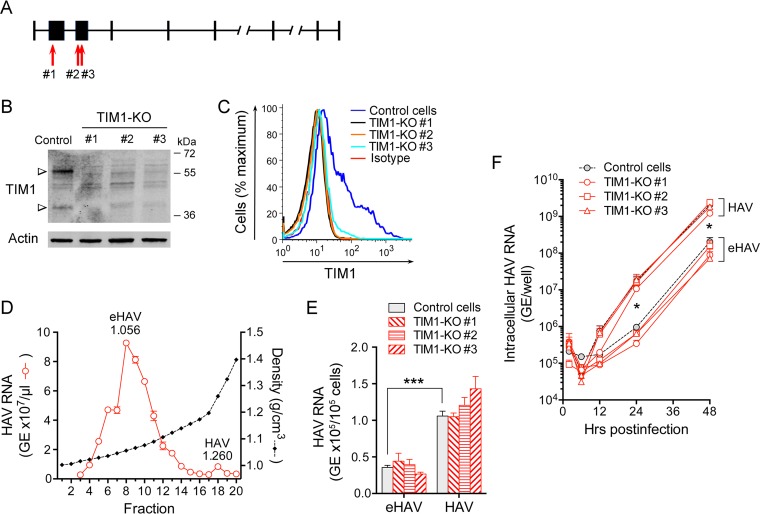
Impact of TIM1 knockout on eHAV and HAV infection of human Huh-7.5 cells. (A) Human HAVCR1 gene structure (NCBI Homo sapiens annotation release 108, accession no. XM_017009340.1; map not drawn to scale). The red arrows show the locations of CRISPR-induced disruption of the TIM1 sequence in exons 2 (KO#1) and 3 (KO#2 and KO#3). (B) Immunoblots of TIM1 and actin (loading control) in lysates of control Huh-7.5 cells and CRISPR/Cas9-generated Huh-7.5 TIM1-KO cells. Anti-TIM1 reactive bands appear at ∼38.7 kDa (predicted TIM1 molecular mass) and ∼55 kDa. (C) Surface expression of TIM1 on control Huh-7.5 and TIM1-KO cells quantified by flow cytometry. “Isotype” refers to the immunoglobulin control. (D) Distribution of HAV RNA in an isopycnic iodixanol density gradient loaded with supernatant fluids of HM175/18f-infected Huh-7.5 cells. The abundance of eHAV, the predominant form of virus present in supernatant fluids, peaked in fraction 8 (1.056 g/cm3), whereas naked HAV formed a small peak in fraction 18 (1.260 g/cm3). (E) Adherence of HAV and eHAV to control Huh-7.5 and Huh-7.5 TIM1-KO cells at 4°C determined by RT-qPCR specific for viral RNA. Differences in residual virus bound to parental versus TIM1-KO cells did not achieve statistical significance. Error bars = SEM; n = 6 (2 independent experiments, each with 3 technical replicates). (F) Accumulation of intracellular HAV RNA in Huh-7.5 and related TIM1-KO cells following infection at 37°C with eHAV or HAV inocula containing similar amounts of HAV RNA. Viral RNA in HAV-infected cells significantly exceeded that in eHAV-infected cells at 24 and 48 h, but differences between control and any TIM1-KO cell line infected with the same inoculum did not achieve statistical significance. Error bars = SEM; n = 4 (2 independent experiments each with 2 technical replicates). Values in panels E and F that were significantly different for eHAV versus HAV by two-way analysis of variance (ANOVA) are indicated by bars and asterisks as follows: *, P < 0.05; ***, P < 0.001.

