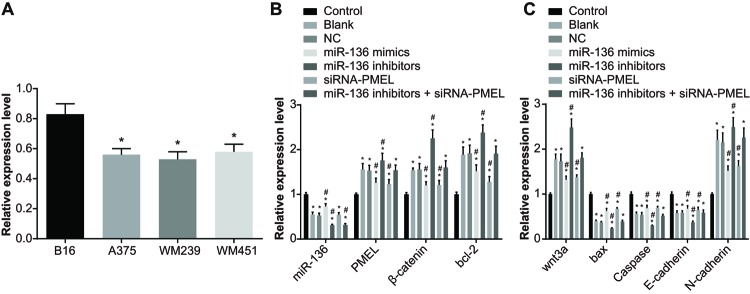
Figure 5. The miR-136 expression and mRNA expressions of Bax, Caspase, E-cadherin, PMEL, β-catenin, Bcl-2, Wnt3a, and N-cadherin in each group.
(A) The differences in miR-136 expression amongst the four cell lines; *, P<0.05 compared with B16; (B,C) the mRNA expressions in each group after transfection; *, P<0.05 compared with the control group; #, both P<0.05, compared with the blank group and NC group.

