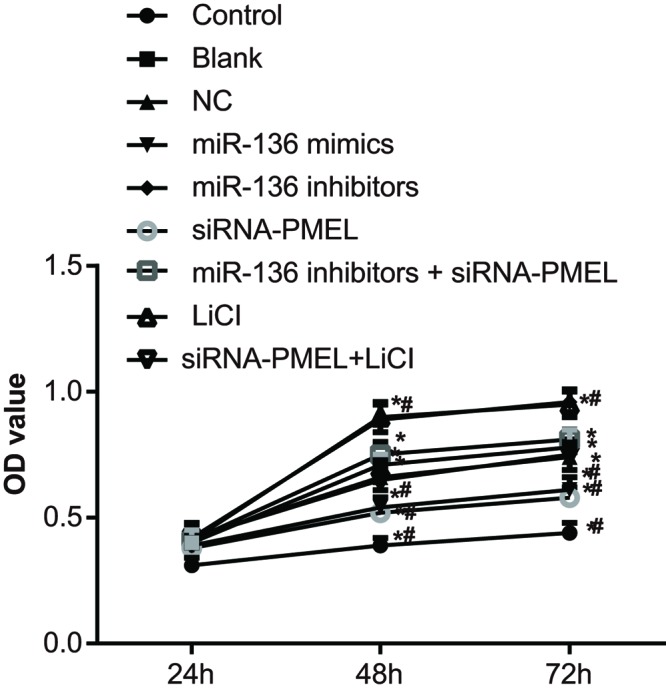
Figure 7. Results of cell proliferation in each group at 24, 48, and 72 h after transfection.

*, P<0.05 compared with the control group, #, P<0.05, compared with the blank group and NC group.

*, P<0.05 compared with the control group, #, P<0.05, compared with the blank group and NC group.