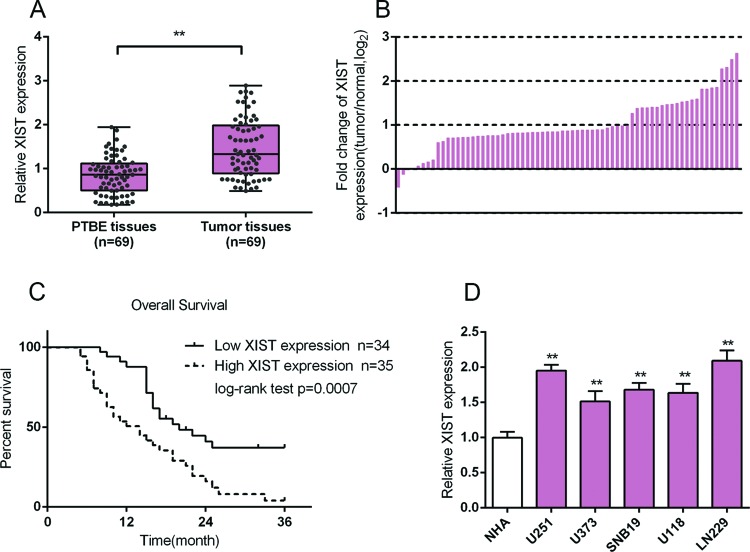
Figure 1. Expression of XIST in glioma tissues and its relationship with the clinical features in patients with glioma.
(A,B) Expression of XIST in 69 paired glioma tissues and PTBE tissues were determined using real-time PCR assays. Fold changes of XIST expression was exhibited as log2 (tumor/normal). (C) Kaplan–Meier overall survival curves for 69 patients with glioma classified according to relative XIST expression level. (D) The expression levels of XIST in five glioma cell lines, U251, U373, LN229, U118, LV229, and a normal cell line, NHA, were determined using real-time PCR. The data are presented as mean ± S.D. of three independent experiments; **P<0.01.

