
Figure 1.
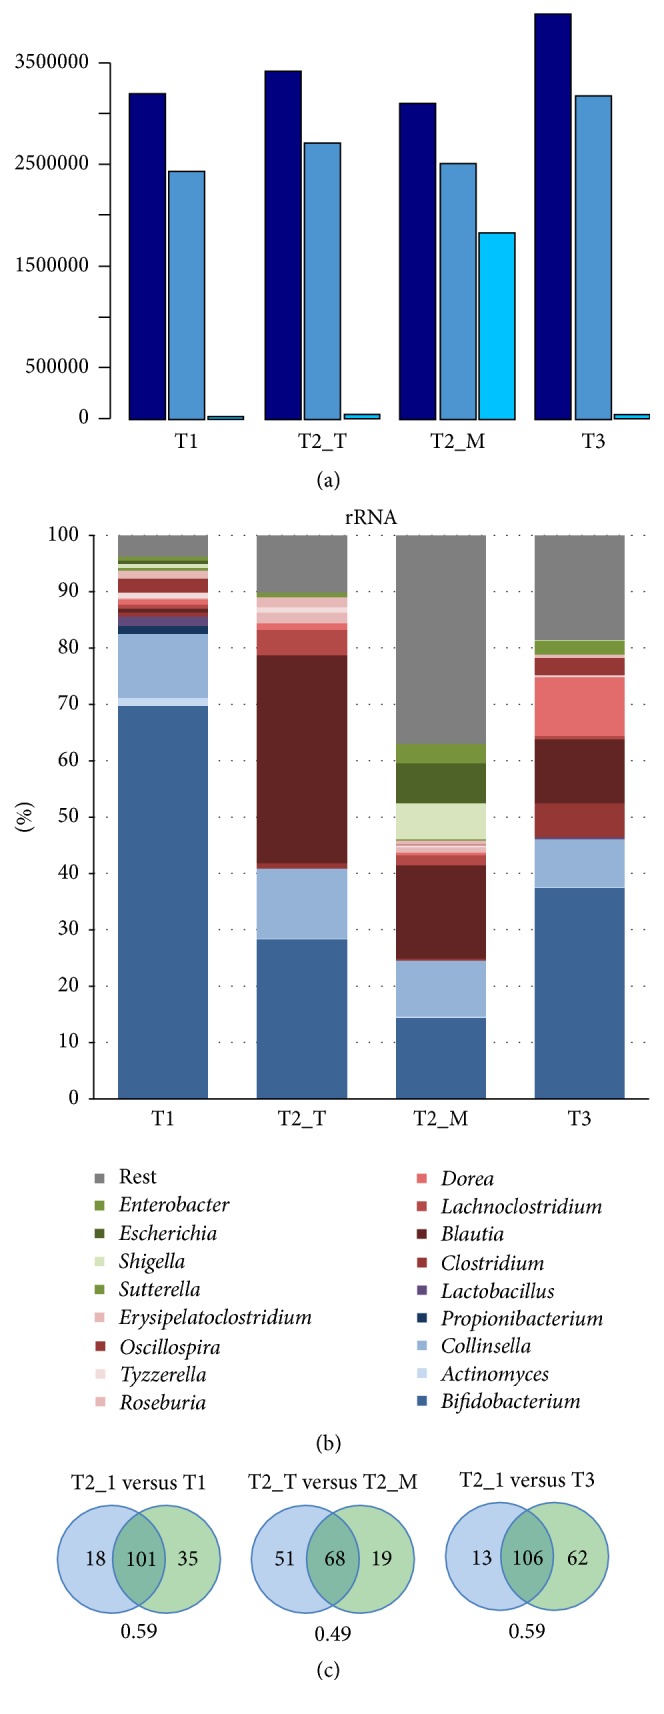
(a) Numbers of reads at different stages of in silico filtering. Raw reads (dark blue), after quality filtering (medium blue) and after quality and rRNA filtering (light blue). (b) Taxonomic profiles based on 16S rRNA. (c) Numbers of shared genera between T2_T and other samples. The Jaccard index below the Venn diagrams shows the relationship between shared and all genera.