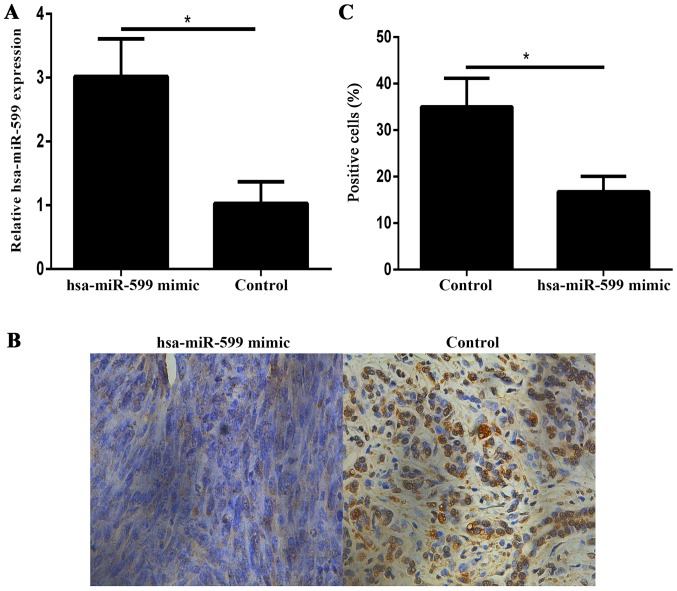
Figure 6.
Hsa-miR-599 downregulated BRD4 expression in tumor xenografts. (A) qPCR analysis of Hsa-miR-599 expression levels in the hsa-miR-599 mimics tumor xenograft mice and control tumor xenograft mice. (B) Representative images (×200 magnification) of breast tumor sections of the control and hsa-miR-599 mimics MCF-7 tumors stained for BRD4. (C) Quantification of the percentage of bromodomain containing 4 (+) cells in the breast tumor sections (*P<0.05).

