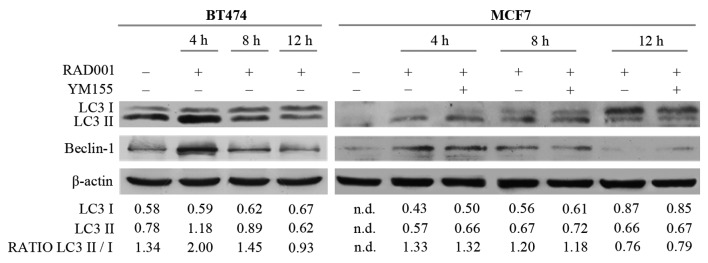
Figure 3.
Induction of autophagy following short RAD001 treatment times, as assessed by western blotting. Densitometry quantitation of bands are indicated for LC3I, LC3II and for the LC3II/LC3I ratio; the densitometry value of LC3I and LC3II was normalized to the β-actin value. LC3, microtubule associated LC3 (LC3-I–II).

