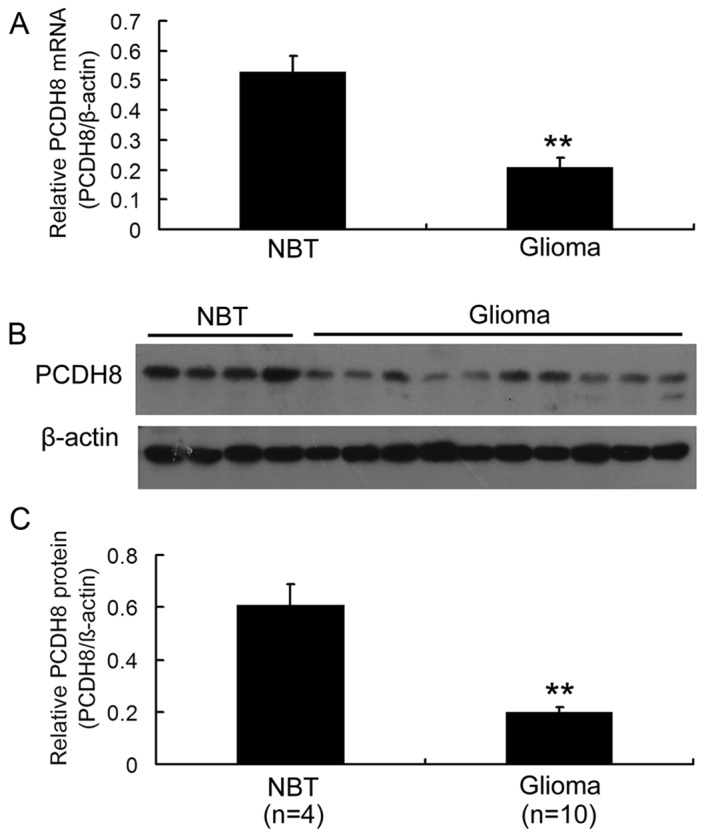
Figure 1.

Expression of PCDH8 mRNA and protein in NBT and human glioma tissues. (A) Reverse transcription-quantitative polymerase chain reaction analysis of the mRNA levels of PCDH8. (B) Western blot analysis of the protein expression of PCDH8. (C) The statistical analysis of relative expression level of PCDH8 in non-tumorous brain tissues (n=4) and glioma tissues (n=10). **P<0.01 vs. the NBT group. PCDH8, protocadherin-8; NBT, normal brain tissue.
