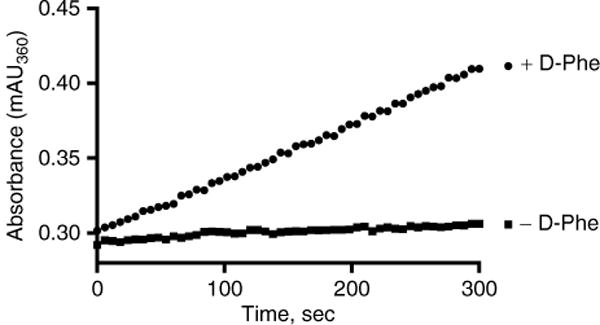
Fig. 2.

Time course of 7-methylguanine production. Each reaction contained 50 mM Tris–HCl, pH 8.0, 5 mM MgCl2, 5 nM GrsA−APhe, 0.04 U IP, 0.1 U PNP, 200 μM MesG, 1 mM TCEP, 150 mM hydroxylamine, 5 mM ATP. The control reaction contained no D-Phe while the positive reaction contained 1 mM D-Phe
