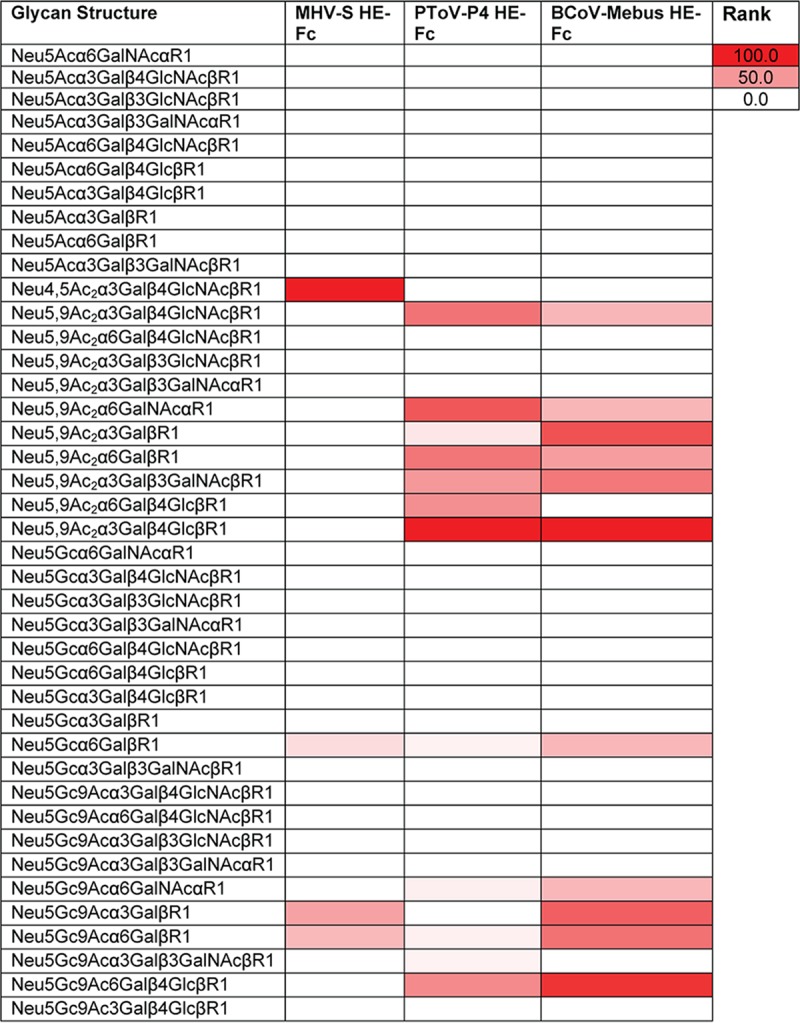
FIG 2 .

Glycan microarray screening of MHV-S HE-Fc, PToV-P4 HE-Fc, and BCoV-Mebus HE-Fc. The binding is presented in heat map form. The heat map was generated according to a method previously described (87). Binding was ranked and calculated as follows, where RFU represents relative fluorescence units: (glycan RFU/maximum glycan RFU) * 100. Binding data represent results determined at 40 µg/ml (n = 4, standard deviations [SD]).
