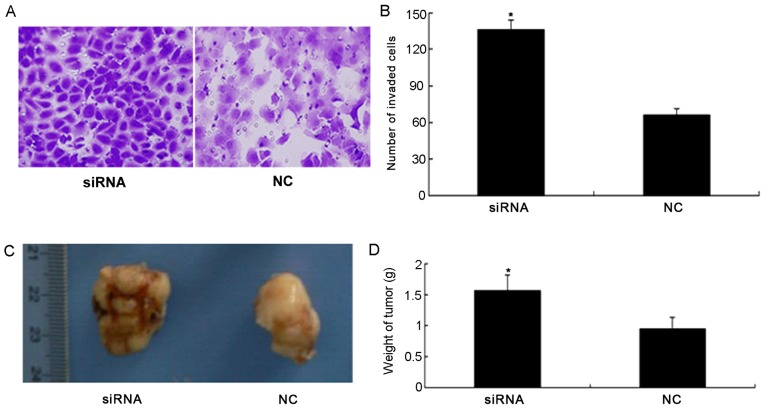
Figure 4.
(A) Representative images of Transwell invasion assay. The 786-O cells were transfected with NC siRNA and PDCD4 siRNA. (B) The ability of cells to invade in the PDCD4 siRNA group was significantly increased compared with the NC group. (C) Image of tumors from the nude mice NC and PDCD4 siRNA groups. (D) The weight of tumors in the PDCD4 siRNA group were significantly increased compared with the NC. Student's t-test was used for comparisons of two independent groups. *P<0.05 vs. the NC group.

