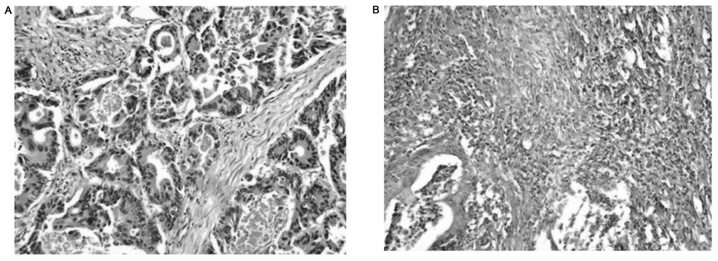
Figure 3.
Assessment of TSP based on H&E staining. (A) Low-TSP group presents less than 50% tumor stroma with strong inflammatory cell infiltrate in the centrum of primary tumor mass. (B) Sections with high-TSP group are characterized by undifferentiated fibrotic stroma and lack of inflammatory cells in most of cases. TSP, tumor stroma percentage; H&E, hematoxylin and eosin.

