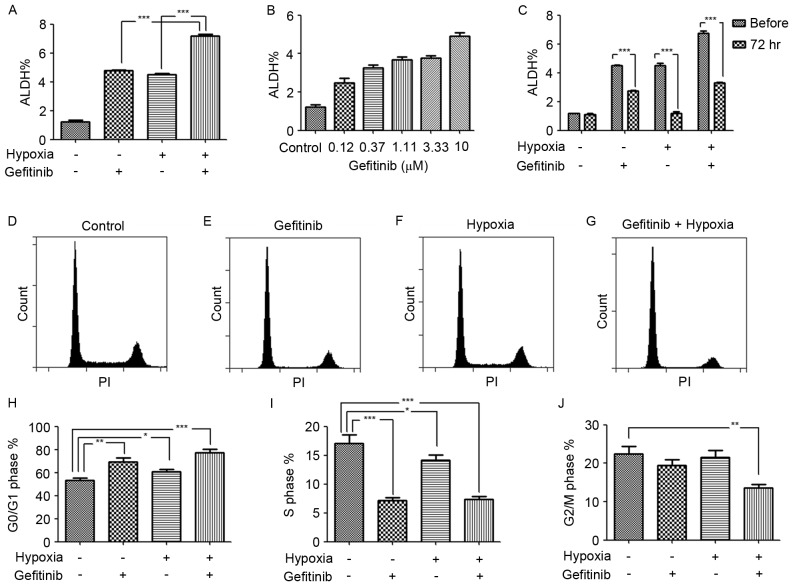
Figure 3.
Increased ALDH expression level following gefitinib and/or hypoxia treatment and enrichment of quiescent G0/G1 phase cells. (A) Ratios of ALDH-positive cells in PC9 cells, gefitinib- and/or hypoxia-treated PC9 cells. Gefitinib- and hypoxia-co-treated PC9 cells demonstrated significantly increased ratio of ALDH-positive cells compared with gefitinib or hypoxia treatment alone. Results are presented as the mean ± standard deviation (n=3). ***P<0.001. (B) An ALDEFLUOR assay revealed increased ALDH expression levels following treatment of PC9 cells with dose concentrations of gefitinib for 72 h. Results are presented as the mean ± standard deviation (n=3). (C) Unstable ALDH expression levels in short-term gefitinib- and/or hypoxia-treated PC9 cells after passaging and treatment cancellation for 72 h. Results are presented as the mean ± standard deviation (n=3). ***P<0.001. Flow cytometric cell cycle analysis. Results are from a typical cell cycle experiment of (D) PC9 cells under normoxia, (E) PC9 cells treated with gefitinib under normoxia, (F) PC9 cells under hypoxia and (G) PC9 cells treated with gefitinib under hypoxia. Statistics are presented as the percentages of total cells in the (H) G0/G1 phase, (I) S phase and (J) G2/M phase. Co-treatment of PC9 cells with hypoxia and gefitinib significantly increased G0/G1 cell cycle phase quiescent cells compared with hypoxia or gefitinib treatment alone, and revealed decreased proportions of S and G2/M phase cells. Results are presented as the mean ± standard deviation (n=3). *P<0.05, **P<0.01 and ***P<0.001. ALDH, aldehyde dehydrogenase.

