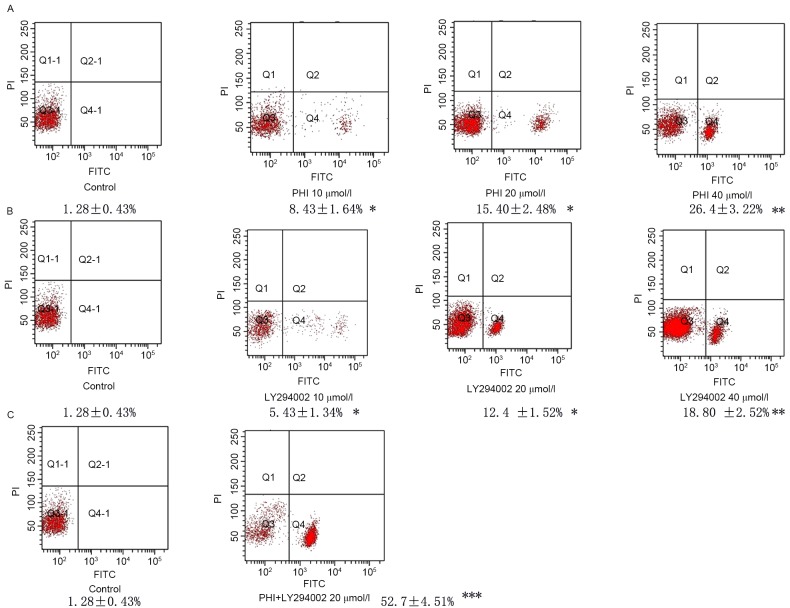
Figure 2.
PHI and LY294002 induce apoptosis in HL-60 cells. Fluorescence signals from annexin V-FITC and PI are reported on the x-axis and y-axis, respectively. Four quadrants represent viable (lower left), necrotic (upper right), early apoptotic (lower right) and late apoptotic (upper right) cells. The rate of apoptosis of the cells is presented in the figure. (A) Apoptosis was increased gradually following treatment with PHI at 10, 20 and 40 µmol/l for 72 h in HL-60 cells vs. untreated control. (B) Apoptosis was increased gradually following treatment with LY294002 at 10, 20 and 40 µmol/l for 72 h in HL-60 cells vs. untreated control. (C) PHI and LY294002 in combination significantly increased apoptosis in HL-60 cells vs. PHI or LY294002 alone. *P<0.05, **P<0.01, ***P<0.001; FITC, fluorescein isothiocyanate; PI, propidium iodide; Q, quadrant.

