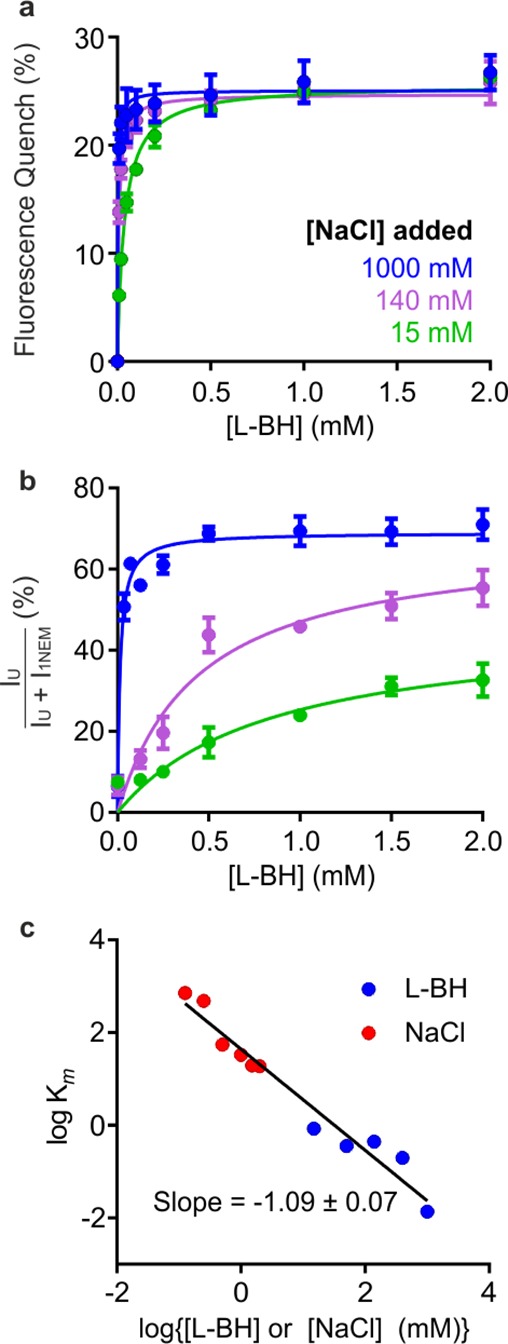
Figure 4.

Titrations of Mhp1 with L-BH monitored by fluorescence and titratable effects of NEM labeling. (a) Tryptophan fluorescence quenching of Mhp1 upon titration with L-BH, in the presence of 15 mM (green), 140 mM (magenta), and 1000 mM (blue) added NaCl. (b) Quantification of unlabeled Mhp1 as a function of increasing [L-BH], at the same concentrations of NaCl as those in panel a. Data are shown as mean ± SEM of three independent measurements; additional titrations are shown in Figure S4. (c) Plot of log Km for either L-BH (blue) or Na+ (red) against either log[L-BH] (blue) or log [Na+] (red). The slope of the best fit line through all points was −1.09 ± 0.07, consistent with a 1:1 Na+:L-BH stoichiometry.56
