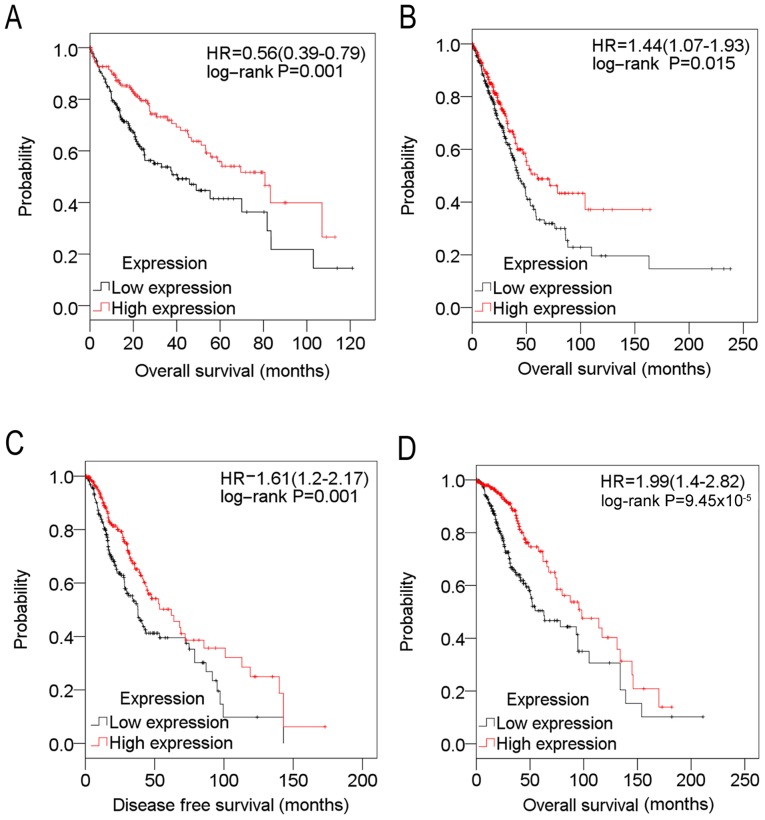
Figure 3.
Kaplan-Meier estimator survival plots for SPARCL1 in (A) liver cancer, (B) lung cancer, (C) glioma and (D) glioma, on the basis of data retrieved from The Cancer Genome Atlas cohort. Expression values of SPARCL1 were divided into high (red line) and low (black line) expression using the median as the threshold value. SPARCL1, SPARC-like protein 1; HR, hazard ratio.

