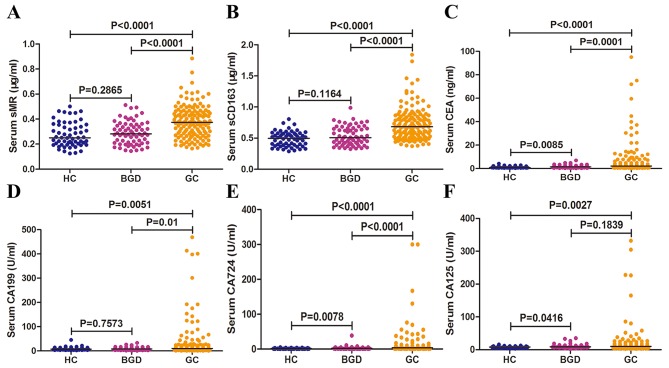
Figure 1.
Preoperative serum sMR, sCD163, CEA, CA199, CA125 and CA724 concentrations in three groups. Preoperative serum levels of sMR (A), sCD163 (B), CEA (C), CA199 (D), CA724 (E), and CA125 (F) in three groups. Each point represents the serum sMR, sCD163, CEA, CA199, CA125 or CA724 level of one sample. The horizontal line indicates the median level. HC, healthy control; BGD, benign gastric disease; GC, gastric cancer.

