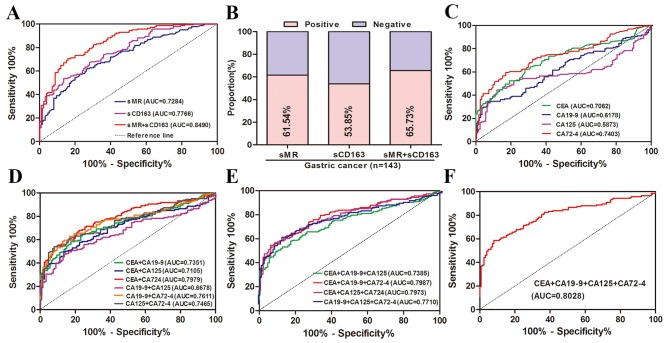
Figure 2.
Diagnostic potential of preoperative serum levels of sMR, sCD163, CEA, CA199, CA125 and CA724 in GC detection. (A) ROC curves for sMR, sCD163 and the combination of them for GC patients vs. all controls. (B) Positive rates of sMR, sCD163 and the combination of them for GC patients vs. all controls. (C) ROC curves for single of CEA, CA199, CA125 and CA724 for GC patients vs. all controls. (D) ROC curves of combined determination for two of CEA, CA199, CA125 and CA724 for GC patients vs. all controls. (E) ROC curves of combined determination for three of CEA, CA199, CA125 and CA724 for GC patients vs. all controls. (F) ROC curves for combined determination of CEA, CA199, CA125 and CA724 for patients with GC vs. all controls. ROC, receiver operating characteristics; AUC, area under curve.

