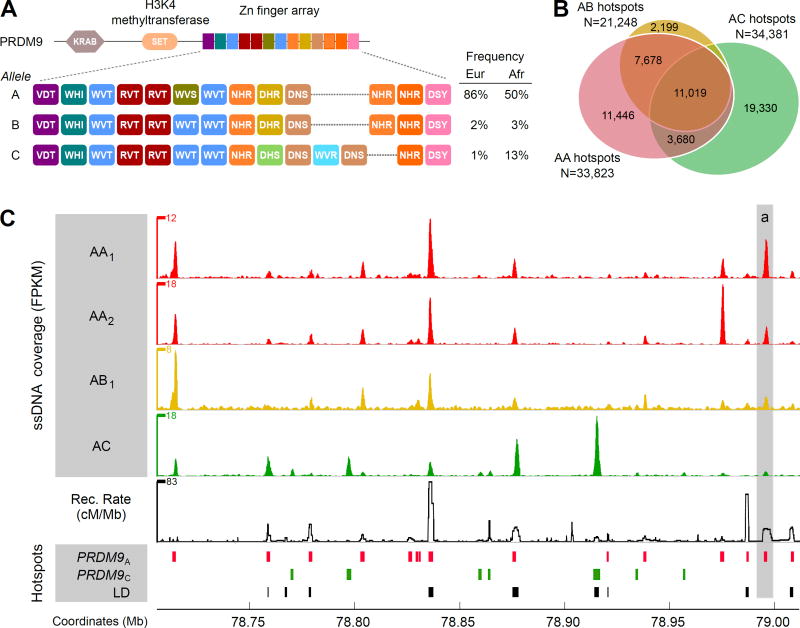
Figure 1. Genome-wide distribution of DSB hotspots in human individuals.
(A) Zn finger array structure of PRDM9 alleles in individuals from this study. Population allele frequencies are taken from (9). (B) The overlap between autosomal hotspots found in different individuals. AA hotspots are the hotspots found in either AA1 or AA2 individuals. (C) DSB hotspots from AA1, AA2, AB1 and AC individuals in a 300 Kb region on chromosome 17. The top four panels show normalized ssDNA coverage in fragments per Kb per million (FPKM), smoothed using a sliding window (window: 1 Kb; step: 0.1 Kb). The baseline of the y-axes is 0 FPKM. The fifth panel shows the recombination rate calculated from the population-averaged HapMap data (15). The lower panels show PRDM9A- and PRDM9C-defined DSB hotspots and LD-defined hotspots.

