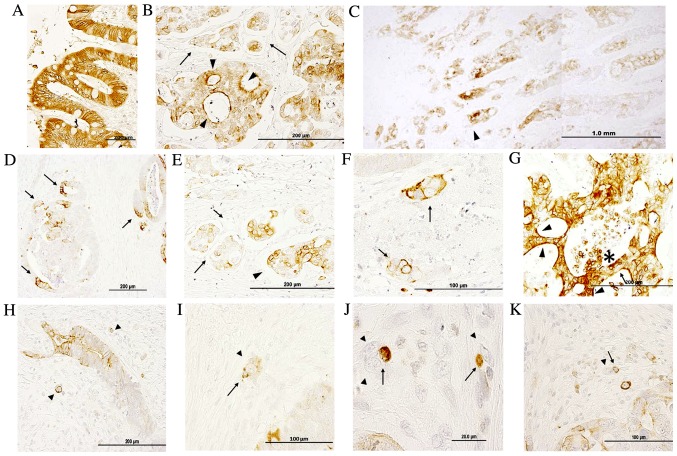
Figure 1.
Immunohistochemical analysis of IQGAP1 protein expression in normal colon and colon adenocarcinoma tissue sections. (A) In normal colon tissue, positive staining was observed in the nuclear membrane, and in the lateral cell membrane and cytoplasm. (B) Tumor exhibiting heterogeneous IQGAP1 localization in the cytoplasm, nuclear membrane and plasma membrane. Arrowheads point to intense apical cell membrane staining, while arrows indicate budding tumor cells. (C) Low magnification of a CRC tumor section demonstrating a higher grade of IQGAP1 expression at the invasive front (arrowhead). (D) Tumor glands exhibiting a polarized positive signal. Cells located at the invasive front exhibited a strong membranous staining (arrows). (E) Tumor budding at the invasive front. Arrows identify open lumen lymphatic ducts with disseminated cancer cell nests. Nests demonstrated variable staining in the cytoplasm and nuclear envelope. Arrowhead points to the invasive lesion. (F) Cancer cell clusters with intense membranous staining (arrows) and lighter staining in cytosol. (G) Intense immunopositivity in a tumor gland exhibiting diffused localization (cytoplasm and nuclear membrane). Note the strong apical localization (arrowheads). Arrow points to unstained cells intermixed with IQGAP1+ cells. (H-K) Arrowheads identify budding tumor cells. Arrows point to IQGAP1+ immune cells associated with budding cells. Micrographs in the assembled figure were selected from different CRC cases. IQGAP1, IQ-motif containing GTPase activating protein 1; CRC, colorectal adenocarcinoma.

