Figure 2.
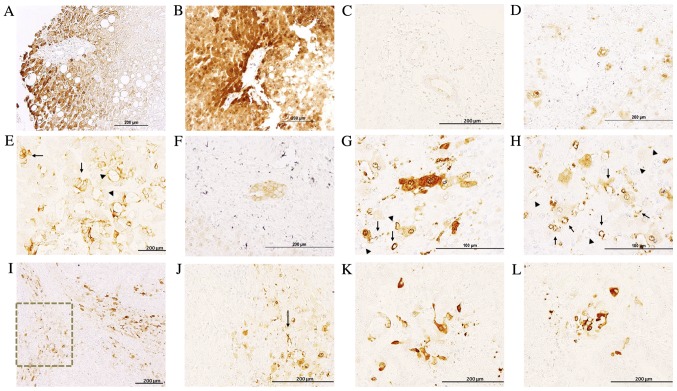
Immunohistochemical analysis of the expression of IQGAP1 in liver tissues. (A and B) Immunohistochemical staining demonstrated variable expression of IQGAP1 in hepatocytes in (A) healthy tissues and (B) a healthy area of metastasized liver tissue. Note that neighboring hepatocytes exhibited significantly different levels of expression. (C) Normal liver bile ducts with weak apical staining. (D) Metastasized liver portal trial with an intense positive membranous staining in bile ducts. (E) Metastases exhibited variable positive staining. Arrows point to malignant cells with strong membranous staining, while arrowheads point to areas of apical cell region staining. (F) Tumor glands demonstrated IQGAP1+ membranous staining. (G and H) Several microvessels exhibited a strong positive signal (arrows), while other vessels appeared negative (arrowheads). (I) Several stromal cells and microvessels located between lesions exhibited intense positive staining. (J) Higher magnification of the inset in (I); arrow points to an IQGAP1+ tumor-associated microvessel. (K and L) IQGAP1− tumor cells with tumor-associated fibroblast-like cells exhibited strong IQGAP1 staining. IQGAP1, IQ-motif containing GTPase activating protein 1.

