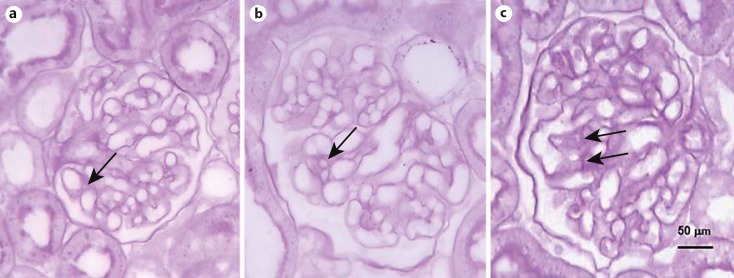
Fig. 2.
Glomerular morphometric changes in diabetic and DI rats. The PAS-positive area exhibited no change in 1-week-old diabetics (b) when compared with controls (a). The MMA was larger in DI (c) than in control and diabetic rats. The arrows point to the mesangial matrix. Five-micrometer paraffin sections. PAS stain. ×400.

