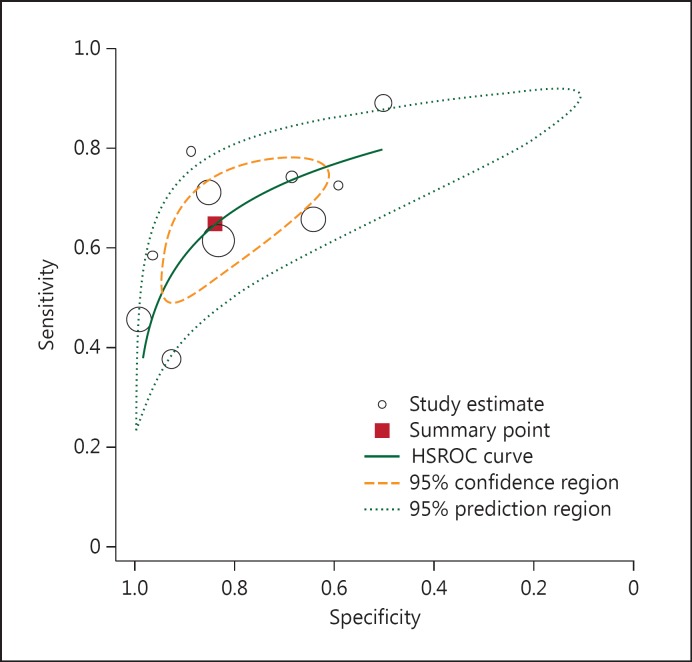
Fig. 1.
HSROC curve of the sensitivity versus specificity of the BISAP score for the diagnosis of SAP. The curve is represented by the straight line; each of the analyzed studies is represented by a circle; the point estimate to which summary sensitivity and specificity correspond is represented by the square and the respective 95% CI by the dashed line, whereas the 95% confidence area in which a new study will be located is represented by the dotted line.

