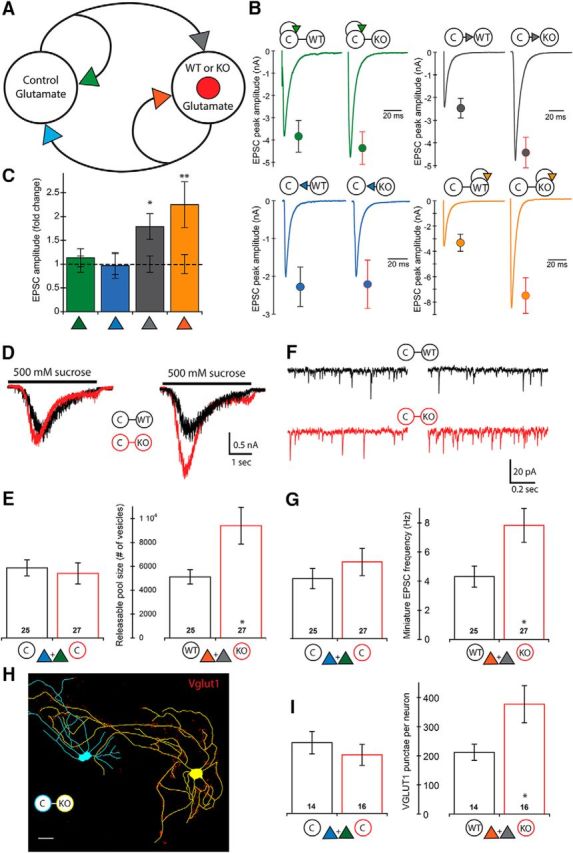
Figure 2.

Loss of PTEN in E-E pairs leads to increased synaptic strength onto the postsynaptic neuron only. A, Schematic of an E-E pair shows the four synaptic connections tested (color-coded arrowheads). B, Representative traces and mean ± SEM values for Control (left traces and circles) and Mutant (right traces and circles) pairs are shown for each of the four connections. Color code matches the connections shown in A. A summary of all values, numbers of neurons tested, and statistical results are in Table 1. C, Bar graph represents the normalized mean ± SEM EPSC peak amplitude values for each of the four connections [Mutant pair relative to Control pair (dotted line)]. D, Representative traces indicate the current response to the 500 mm sucrose application used to assay the size of the readily releasable pool of synaptic vesicles onto each neuron in Control (black traces) and Mutant (red traces) pairs. E, Bar graphs represent the increase in the number of available synaptic vesicles onto the Pten-KO neurons (numbers on bars indicate the number of neurons analyzed). Bars represent color-matched traces directly above them. F, Representative traces indicate the mEPSC activity recorded in each neuron in Control (black traces) and Mutant (red traces) pairs. G, Bar graphs represent the increase in the mEPSC frequency recorded in the Pten-KO neurons (numbers on bars indicate the number of neurons analyzed). Bars represent color-matched traces directly above them. H, Representative tracing of a Con (blue) and Pten-KO (yellow) E-E Mutant pair showing VGLUT1 staining (red punctae). Scale bar, 25 μm. I, Bar graphs represent the increase in the number of VGLUT1 punctae on Pten-KO neurons in E-E pairs (numbers on bars indicate the number of neurons analyzed). *p < 0.05 (Mann-Whitney test). **p < 0.01 (Mann-Whitney test).
