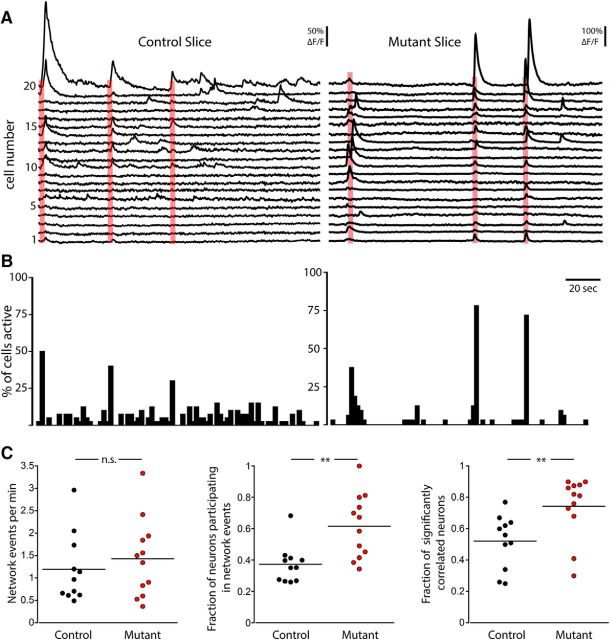
Figure 7.
Loss of PTEN increases synchrony in hippocampal slice cultures. A, Representative fluorescence traces for 20 simultaneously recorded neurons from a Control (left) and a Mutant (right) slice. Red boxes represent network events. B, Event histograms corresponding to the traces in A that illustrate the percentage of total active neurons that had event onsets within each 2 s time bin. C, Dot plots show the frequency of network events (left), the fraction of active neurons that participated in network events (middle), and the fraction of cells displaying a significant correlation (right) in Control (black) and Mutant (red) slices. **p < 0.01 (Mann-Whitney test).

