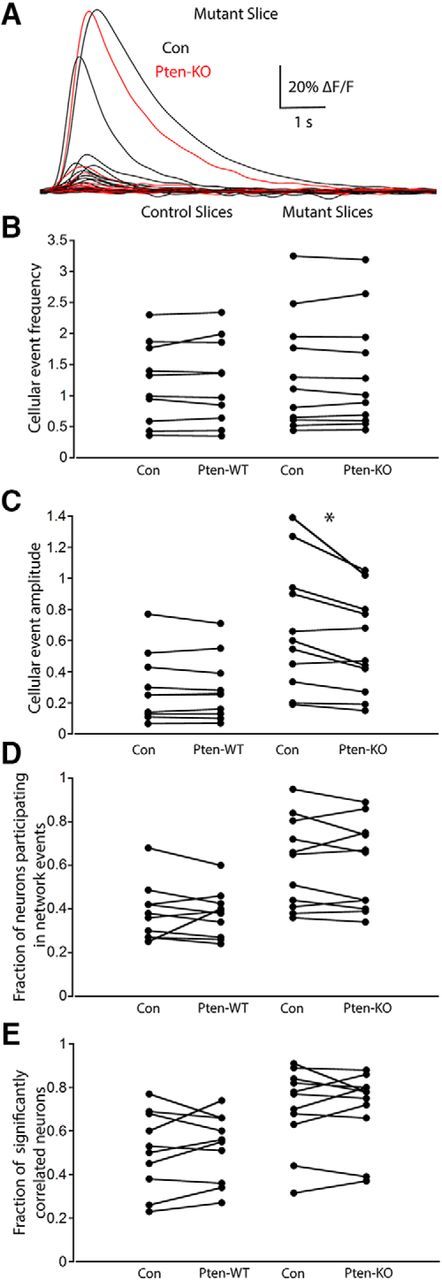
Figure 8.

The changes observed in Mutant slices cannot be accounted for by changes in the activity of Pten-KO neurons alone. A, Fluorescence traces from Con (black traces) and Pten-KO (red traces) neurons during an identified network event in a Mutant slice. B–E, Dot plots showing the measurements of Con and Pten-WT neurons in Control slices (left columns) and Con and Pten-KO neurons in Mutant slices (right columns), for the following: B, the mean frequency of spontaneous events per cell (events per minute); C, the mean amplitude of the spontaneous events (ΔF/F); D, the fraction of the active neurons that participated in network events; and E, the fraction of significantly correlated active neurons. All comparisons were made with the Wilcoxon matched-pairs signed ranks test. *p < 0.05 (Wilcoxon matched-pairs signed ranks test).
