Figure 4.
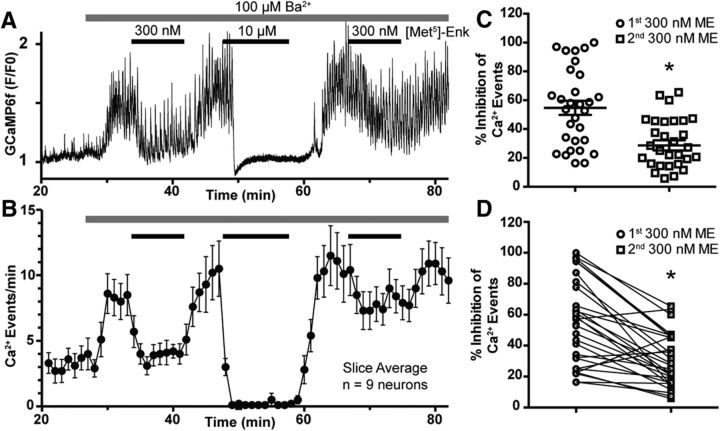
Desensitization of the MOR reduces the inhibition of Ca2+ events by an EC50 concentration of ME. A, Normalized (F/F0) fluorescent GCaMP6f recording illustrating the protocol used to detect MOR desensitization. In the presence of Ba2+ (100 μm), to minimize the GIRK current, a near-EC50 concentration of ME (300 nm) was briefly applied then washed out. Then a 10 min ME (10 μm) application was used to induce MOR desensitization. After washout, a second application of 300 nm ME was used to assess the level of desensitization. B, Slice average (mean ± SEM) for the experiment in A. C, Plot of the percentage inhibition of Ca2+ events before (open circles) and after MOR desensitization (open squares). Each point is an individual neuron, and the horizontal bars are the mean ± SEM. The mean inhibition of Ca2+ events for the first application of 300 nm ME was significantly greater than the mean inhibition for the second application of 300 nm ME (black asterisk; n = 30, neurons, 6 slices, 4 animals). D, Same data as in C paired to show the downward trend between the first and second applications of 300 nm ME.

