
Figure 6.
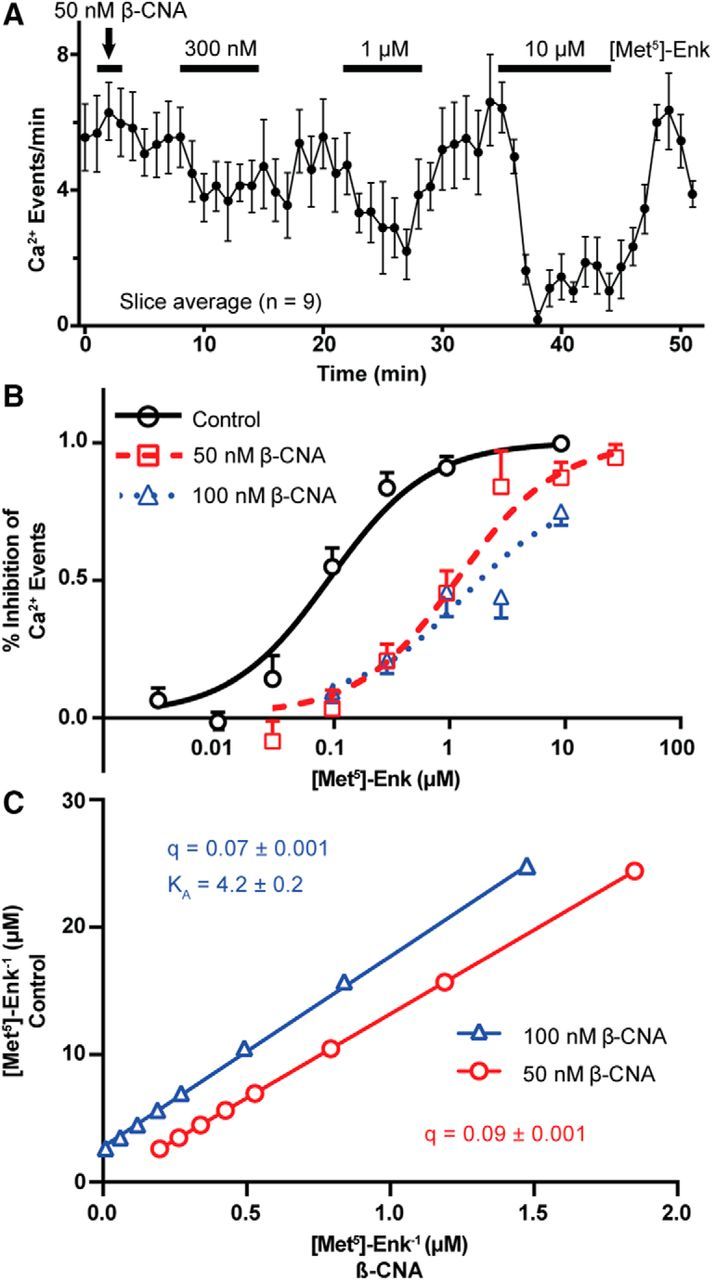
Determination of MOR reserve for the inhibition of Ca2+ events by ME. A, Slice average (mean ± SEM) plotting the frequency of GCaMP6f events in response to increasing concentrations of ME (300 nm, 1 μm, and 10 μm) following a 2 min β-CNA (50 nm) pretreatment. GABAA and AMPA receptor blockers (DNQX and picrotoxin, respectively) were included throughout the recording to occlude the potential effects of presynaptic MORs. B, Dose–response curves for the inhibition of Ca2+ events by ME under control conditions or after pretreatment with 50 or 100 nm β-CNA. Treatment with 50 nm β-CNA caused a significant rightward shift of the EC50 concentration (control, 95 nm; 50 nm β-CNA, 1260 nm), without a concomitant decrease in the maximal inhibition, suggesting the presence of a large receptor reserve. Treatment with 100 nm β-CNA did not significantly shift the EC50 concentration (1410 nm) compared with 50 nm, but there was a decrease in the maximal inhibition to 80%. C, Double reciprocal plot of the concentration of agonist required for equally effective points on the dose–response curve between control (y-axis) and β-CNA treatments (x-axis) as used for the Furchgott (1966) analysis, to calculate q, the proportion of receptors still functional following β-CNA treatment, from the slope of the linear fits.