Figure 7.

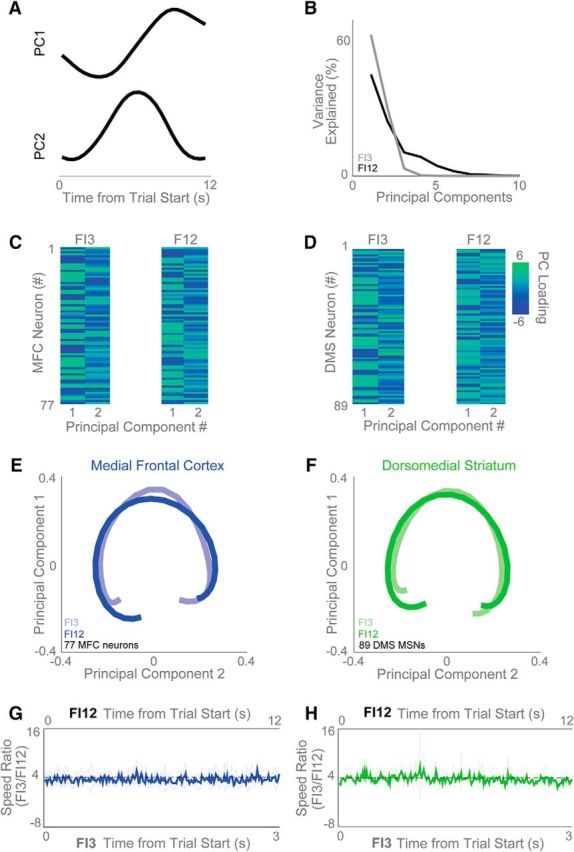
Frontostriatal ensembles scale proportionally at different intervals. A, B, Data-driven principal component analysis (PCA) (A) revealed that ramping activity is the most common principal component (PC1) across frontostriatal ensembles and (B) explained >40% of variance on FI3 (gray) and >60% of variance on FI12 (black) trials. C, D, The strength of loading of PC1 and PC2 are shown for all MFC (C) and DMS (D) neurons. E, F, PCs looked remarkably similar for FI3 and FI12 trials for (E) MFC and (F) DMS neurons. G, H, To quantify the scaling across the entire MFC and DMS ensembles, we examined the speed that neuronal ensemble activity moved in high-dimensional space for FI12 and FI3 trials. We found that the speed was proportional to the interval (ratio of FI12/FI3, or 4:1) for the MFC (G) and DMS (H). Confidence intervals shown in light blue/green.
