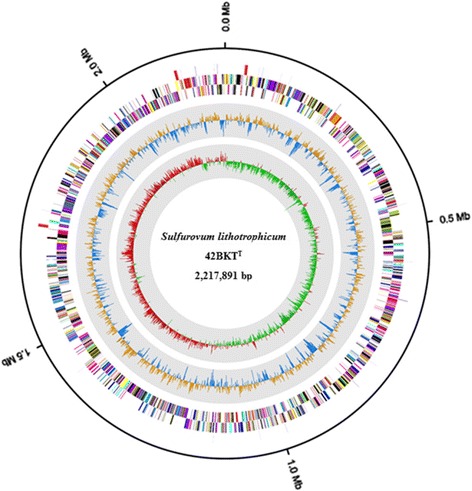
Fig. 3.

Genome map of Sulfurovum lithotrophicum 42BKTT. From the outer to the inner circle: RNA regions (rRNA, red; tRNA, lavender), CDS on the reverse strand (colored based on COG categories), CDS on the forward strand (colored based on COG categories), G + C skew (blue/goldenrod), and GC ratio (green/red)
