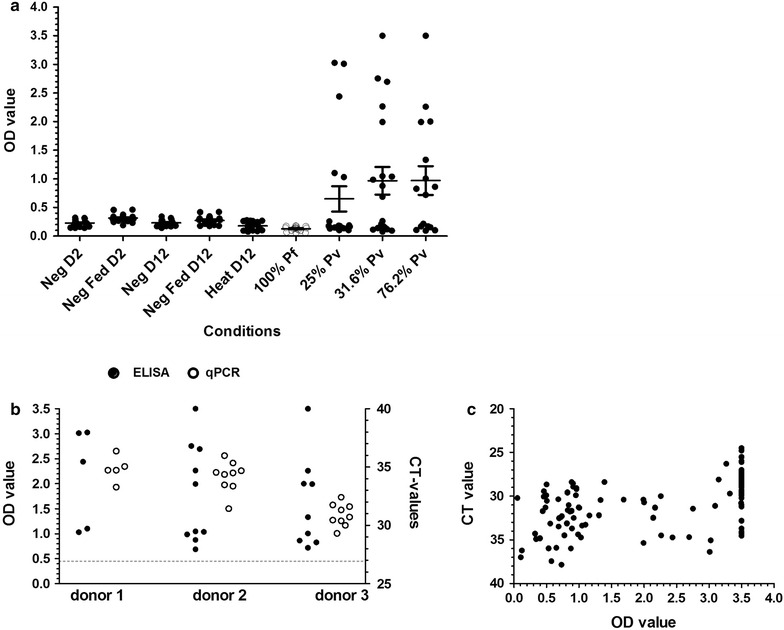
Fig. 5.

Performance of negative controls in P. vivax CSP ELISA and agreement between CSP-ELISA and qPCR. Optical density values are plotted for A. stephensi mosquitoes that received or did not receive a blood meal prior to processing on D2 (day 2) or D12 (day12), high gametocyte culture P. falciparum infected blood fed mosquitoes (100%) and mosquitoes that fed on three microscopy positive P. vivax carriers that were processed on D12 (a). The relative signals from the CSP-ELISA (filled circles) and qPCR data (clear circles) are presented for three donors (b). CSP-ELISA and corresponding qPCR data are shown for 198 mosquitoes that fed on 55 naturally infected P. vivax parasite carriers (c). Dotted line (b) indicates the OD cut-off value. % for the three donors in (a) indicate the percentage of infected mosquitoes
