. 2017 Sep 6;17:609. doi: 10.1186/s12879-017-2637-9

Fig. 4.

Fig. 4

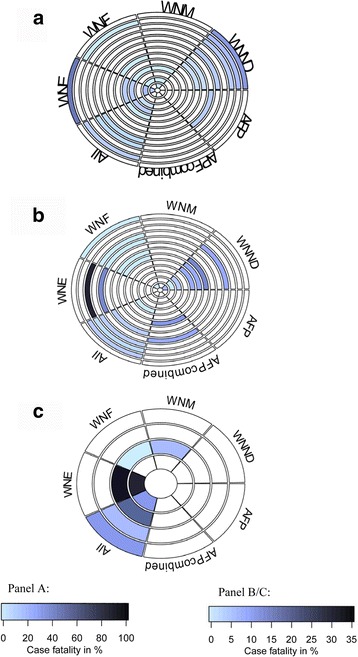
Rank-heat plots summarizing select mortality data in patients with West Nile virus infection. In-hospital mortality (a), acute mortality (b), and long-term mortality (c) are represented by the shaded colour. Darker shading represents greater mortality reported. Each ring within the circle represents a study. Each wedge represents a WNV syndrome. White sectors show studies have no data on the syndrome/are not applicable
A. Rings from outside in refer to: B. Rings from outside in refer to: C. Rings from outside in refer to:
1. Emig 2004 [56] 1. Sejvar 2011 [68] 1. Green 2005 [23]
2. Gottfried 2005 [47] 2. Sotir 2007 [67] 2. Murray 2014 [49]
3. Jeha 2003 [74] 3. Lindsey 2012; Vector Borne Zoonotic Dis [50] 3. Weatherhead 2015 [48]
4. Mazurek 2005 [79] 4. Chung 2013 [66] 4. Lindsey 2012; Vector Borne Zoonotic Dis [50]
5. Johnson 2015 [51] 5. Lindsey 2014 [70]
6. Sejvar 2005 [41] 6. Murray 2013 [6]
7. Téllez-Zenteno 2013 [19] 7. Lindsey 2009 [57]
8. Racsa 2014 [32] 8. Lindsey 2010 [31]
9. Bhangoo 2005 [46] 9. Warner 2003, Michaels 2005 [52, 53]
10. Murray 2006, Murray 2008 [35, 80] 10. Borchardt 2010 [61]
11. Murray 2014 [49] 11. Nolan 2013 [54]
12. Bode 2006 [44] 12. Gaensbauer 2014 [69]
13. Tyler 2006 [45] 13. Lindsey 2012; Am J Trop Med Hyg [58]