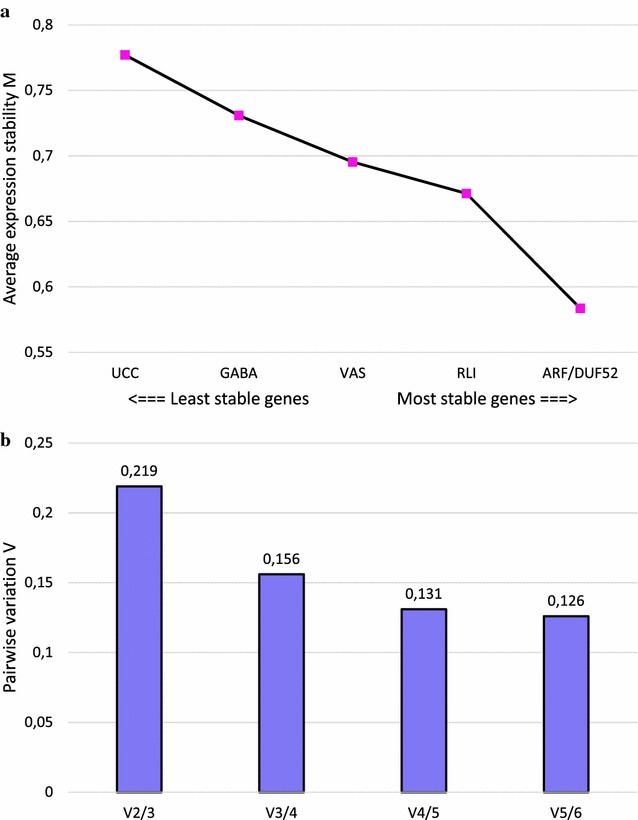
Fig. 2.

geNorm output charts of M and V values for the six tested reference genes. a Average expression stability M of the remaining reference genes after stepwise exclusion of the least stable gene. b Pairwise variation V between two sequential normalization factors containing an increased number of reference genes, calculated for the determination of the optimal number of reference genes for normalization
