
Fig. 4.
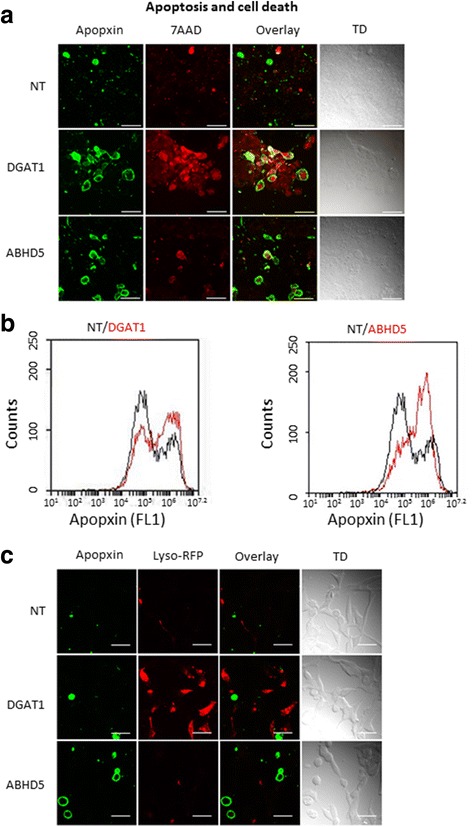
Blocking of ABHD5 and DGAT induces apoptosis and autophagy respectively in LNCaP cells: a Immunofluorescent image showing staining with apopxin (green) and 7AAD (red) after siRNA treatment (72 h). Green only-early apoptotic cells, red only-dead cells and red and green both - late apoptotic or cells with damaged plasma membrane. b Apoptosis assay showing increased cell population of apopxin positive cells with ABHD5 siRNA as compared to NT siRNA using flow method. Black-NT siRNA, Red- DGAT1 and ABHD5 siRNA. Apopxin peak (x axis) at 106 represents the apoptotic cell population. c Immunofluorescent image showing staining with apopxin (green) and Lyso tracker (red) after siRNA treatment (72 h). All immunofluorescent experiments have been performed three times and a representative experiment has been shown. For each experiment 4–5 xy planes were randomly selected for microscopy. Maximum intensity image has been shown in the figures which either included all the z-stacks (a) or some selected z-stack (c - apopxin staining) to depict localization. Bar is 50 μm