
Fig. 5.
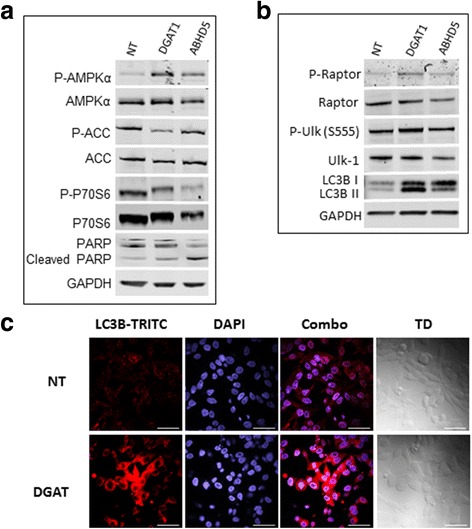
Immunoblotting and immunofluorescence experiments depicting pathways after ABHD5 and DGAT1 siRNA treatment leading to apoptosis and autophagy respectively: a and b- Immunoblotting assay using different antibodies after siRNA transfection with NT (non-target), DGAT1 and ABHD5 siRNA. GAPDH has been used as an internal control. A representative experiment is shown out of the three repeats. c Immunofluorescence assay showing LC3 punctate staining after DGAT siRNA treatment representing autophagy. DAPI (blue)-nucleus and TRITC (red)-LC3. Bar is 50 μm