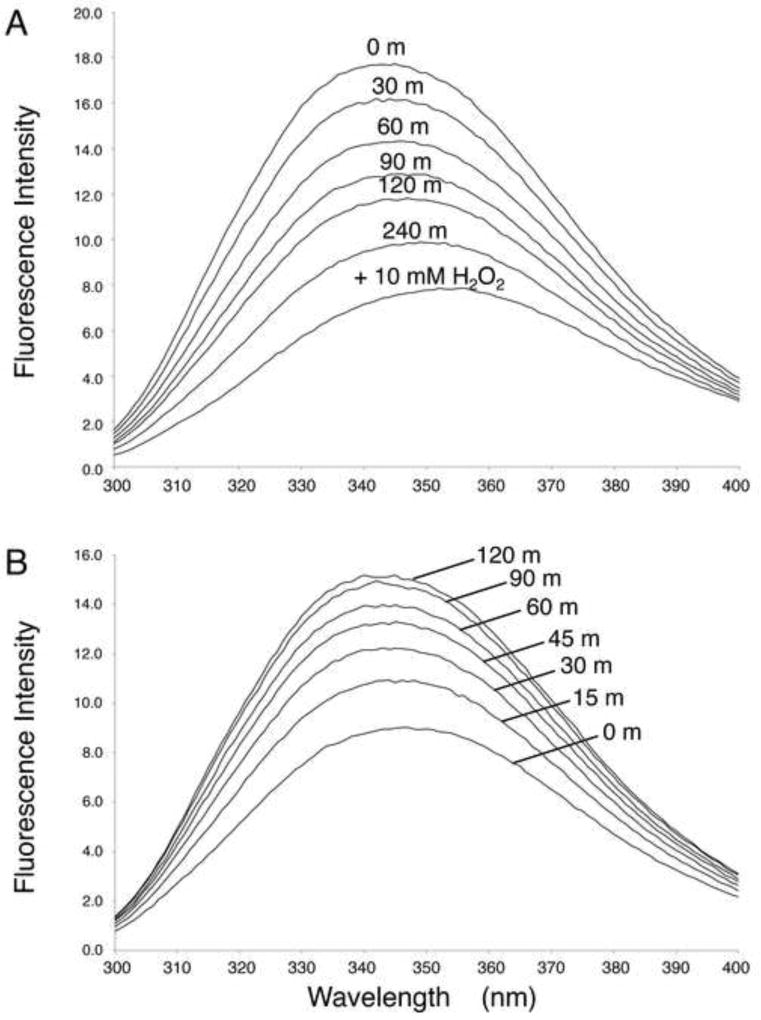
Figure 6.
Dependence of intrinsice fluorescence of X1NTD on redox state. The fluorescence emission spectrum of 2 µM X1NTD is shown as a function of time: A) Oxidation of X1NTDred. 0.5 mM H2O2 was added at t = 0, and spectra were recorded at 30 m intervals. A fully oxidized spectrum was obtained by addition of excess H2O2 after 4 h. or B) reduction of X1NTDox after addition of 0.5 mM DTT. Spectra were recorded at 15 m intervals, as indicated. The buffer for both the oxidation and reduction studies was 50 mM Tris-HCl, pH 7.65, 140 mM NaCl, 75 mM sodium bicarbonate, 0.1 mM EDTA. Spectra were run at 25 °C.

