Figure 1.

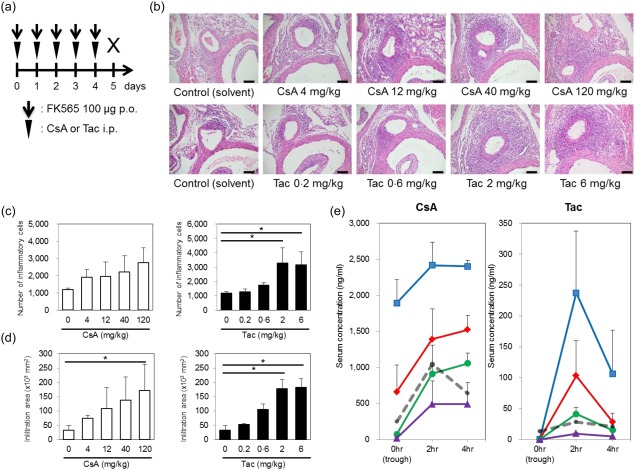
Exacerbation of coronary arteritis by calcineurin inhibitors (CNIs). (a) The experimental protocol; p.o.: per os, i.p.: intraperitoneal injection. The histological evaluation of coronary arteritis (b) induced by cyclosporin A (CsA) or tacrolimus (Tac) and 100 µg of FK565 in wild‐type mice (scale bar, 100 μm). The numbers (c) and infiltration areas (d) of inflammatory cells are shown. The data are presented as the mean ± standard deviation (s.d.) (n = 3). *P < 0·05 (Dunnett's test). (e) After CsA (4, 12, 40 or 120 mg/kg body weight per dose) or Tac (0·2, 0·6, 2 or 6 mg/kg body weight per dose) was administered i.p. once daily for 5 consecutive days, blood concentrations of CsA and Tac at 0 (trough), 2 and 4 h after drug administration on day 5. The data are presented as the mean ± s.d. (n = 3). Cyclosporin A (CsA) (120 mg/kg) and 6 mg/kg of Tac (blue squares), 40 mg/kg of CsA and 2 mg/kg of Tac (red diamonds), 12 mg/kg of CsA and 0·6 mg/kg of Tac (green circles), and 4 mg/kg of CsA and 0·2 mg/kg of Tac (purple triangles). Grey dashed lines represent the blood concentrations of human therapeutic doses (5·26 mg/kg of CsA and 0·16 mg/kg of Tac from Refs [ 18, 20]). [Colour figure can be viewed at wileyonlinelibrary.com]
