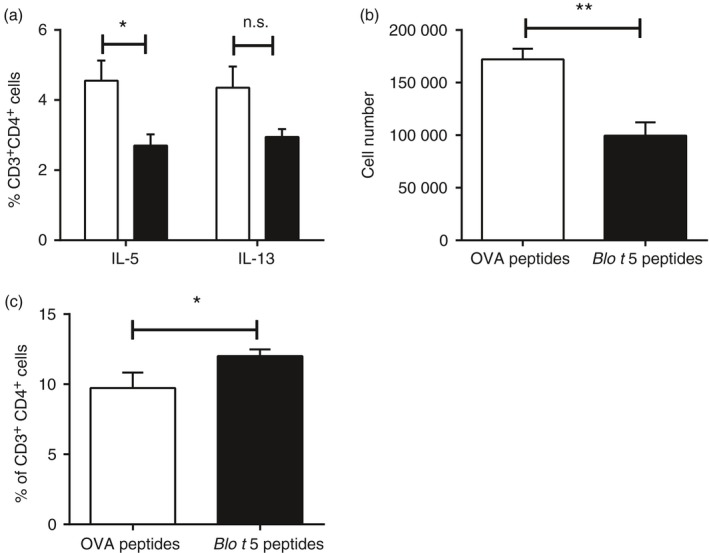
Figure 6.

Response of T helper type 2 (Th2) cells suppressed by peptide immunotherapy. (a) Percentage of CD3+ CD4+ cells secreting interleukin‐5 (IL‐5) or IL‐13 measured by intracellular cytokine staining (n = 5). (b) The number of IL‐33 receptor (T1/ST2) expressing cells gated on CD3+ cells. (c) Programmed death 1 (PD‐1) expression in CD3+ cells in lungs of peptide‐treated mice compared with control mice (n = 10). **P < 0·05, **P < 0·01.
